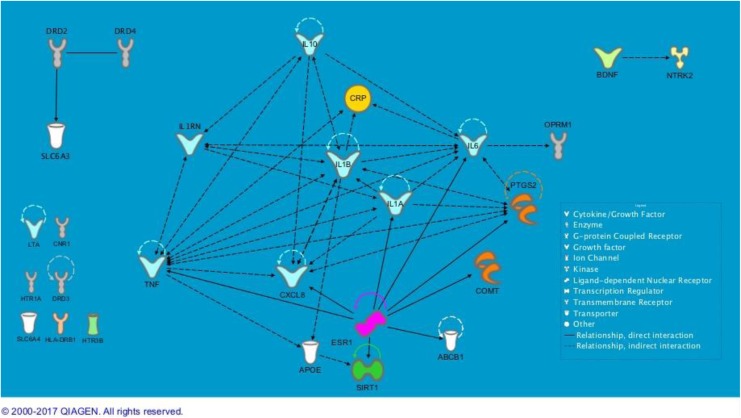
Figure 1.
Relationships among genes associated with two or more symptoms. Ingenuity Pathway Analysis did not find relationships to others for the seven genes in the bottom left corner. Semicircles above genes indicate the gene’s relationship with itself. For example, ESR1 (estrogen receptor 1) inhibits and acts on itself, as indicated by the looped arrow, through many interactions. ABCB1 = ATP-binding cassette subfamily B member 1 gene; APOE = apolipoprotein E gene; BDNF = brain-derived neurotrophic factor gene; CNR1 = cannabinoid receptor 1 gene; COMT = catechol-O-methyltransferase gene; CRP = C-reactive protein gene; CXCL8 = C-X-C motif chemokine ligand 8 gene; DRD2 = dopamine receptor 2 gene; DRD3 = dopamine receptor 3 gene; DRD4 = dopamine receptor 4 gene; ESR1 = estrogen receptor 1; HLA-DRB1 = major histocompatibility complex, class II, DR beta 1 gene; HTR1A = 5-hydroxytryptamine receptor 1 alpha gene; HTR3B = 5-hydroxytryptamine receptor 3 beta gene; IL1A = interleukin 1 alpha gene; IL1B = interleukin 1 beta gene; IL1RN = interleukin 1 receptor antagonist gene; IL6 = interleukin 6 gene; IL10 = interleukin 10 gene; LTA = lymphotoxin alpha gene; NTRK2 = neurotrophic receptor tyrosine kinase 2 gene; OPRM1 = opioid receptor mu 1 gene; PTGS2 = prostaglandin-endoperoxide synthase 2 gene; SIRT1 = sirtuin 1 gene; SLC6A3 = solute carrier family 6 member 3 gene; SLC6A4 = solute carrier family 6 member 4 gene; TNF = tumor necrosis factor gene. Figures produced from IPA are available under an open-access CC-BY license for purposes of publication.

