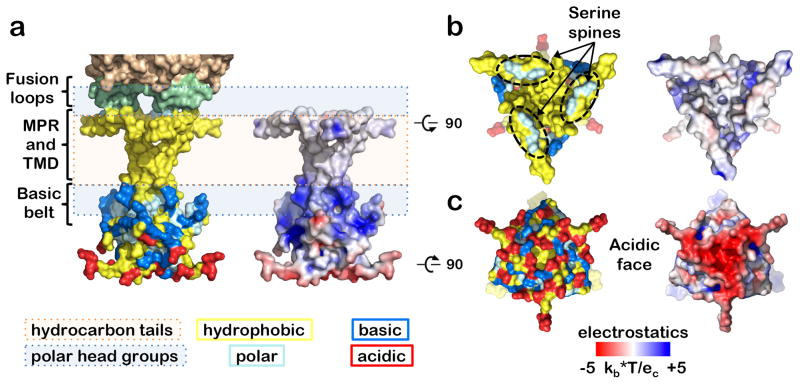
Figure 3.
Orientation of the MPR-TMD-CTD segment in the membrane. This orientation was inferred from residue distribution (left) and electrostatic surface potential (right) is shown in side (a), top (b), and bottom (c) views. Residues are shown as follows: hydrophobic (A, V, L, I, F, W, Y, G, P, M) in yellow, polar (S, T, N, Q, H) in cyan, acidic (D, E) in red, and basic (K, R) in marine. The inferred location of the membrane is shown schematically using peach (hydrophobic core) and light blue (polar head group) boxes. The hydrophobic MPR and TMD are buried in the nonpolar bilayer core except for the serine “spine” of the MPR, which protrudes into the polar headgroups of the outer leaflet. The basic belt in the TMD and the CTD interacts with the polar headgroups of the inner leaflet. The inner face of the CTD is largely acidic.

