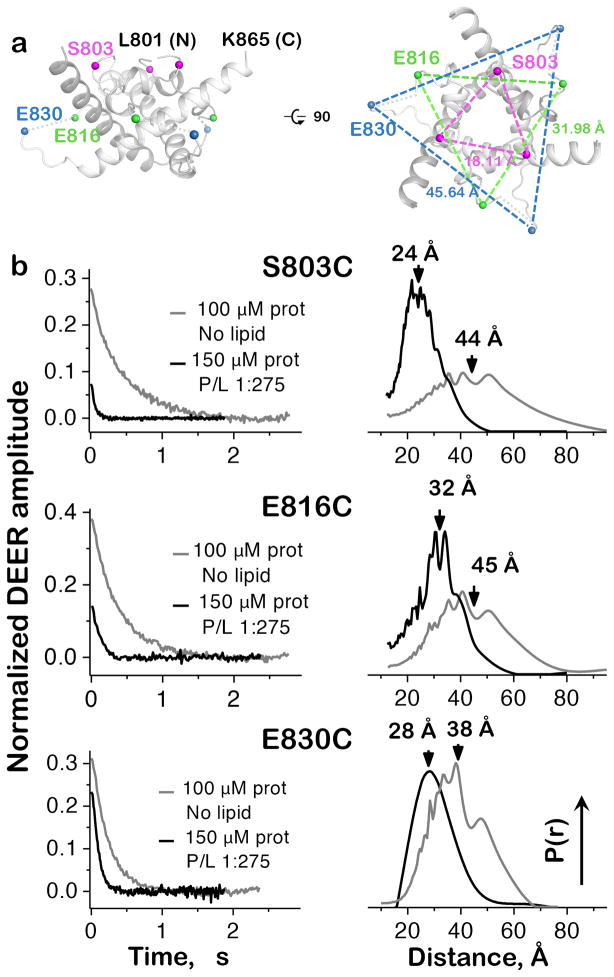
Figure 5.
Inter-protomer distances in the isolated CTD. (a) Positions of DEER labeling sites and their distances in the crystal structure of gBΔ71. Only residues 801-865 of the CTD are shown for clarity. (b) Experimental time-domain DEER data (left) and reconstructed inter-protomer distance distributions (right) for the CTD mutants S803C, E816C, and E830C. Protein in buffer alone is disordered, with broad, widely varying separation between equivalent residues on different protomers. Conversely, distance distributions for samples with a protein:PC/PA liposome ratio of 1:275 coalesce around shorter separation distances, indicating global organization of the CTD. Mutants S803C and E816C were tested once, while two biological replicates of E830C produced superimposable distance distributions.

