Figure 2.

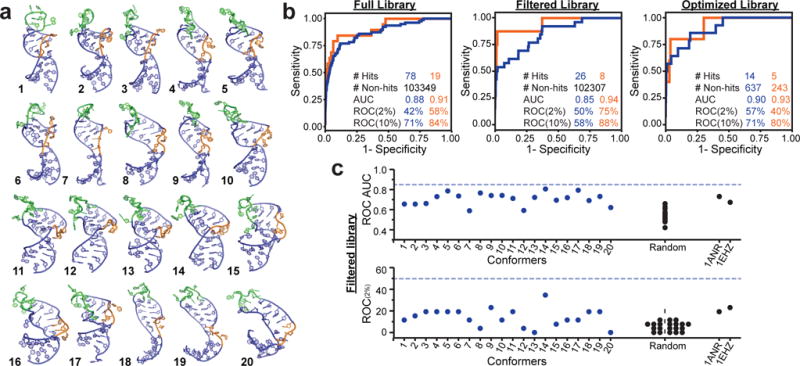
Evaluating EBVS against the RDC TAR dynamic ensemble a. The twenty conformers of the of TAR dynamic ensemble (E0,4rdc). b. ROC curve analysis showing EBVS enrichment of all hits (blue) and cell-active hits (orange) for all three libraries. c. ROC AUC and ROC(2%) scores for docking against individual conformers of the E0,4rdc ensemble, a randomly selected MD ensemble (E0,ran), and the lowest energy NOE-based structures for apo-TAR (PDB 1ANR) and tRNA (PDB 1EHZ) for the Filtered library. Dashed lines indicate the values for the full N=20 E0,4rdc ensemble. Results for the Full and Optimized libraries are shown in Supplementary Fig. 7. ROC plots were generated from one run of docking all molecules to all receptors.
