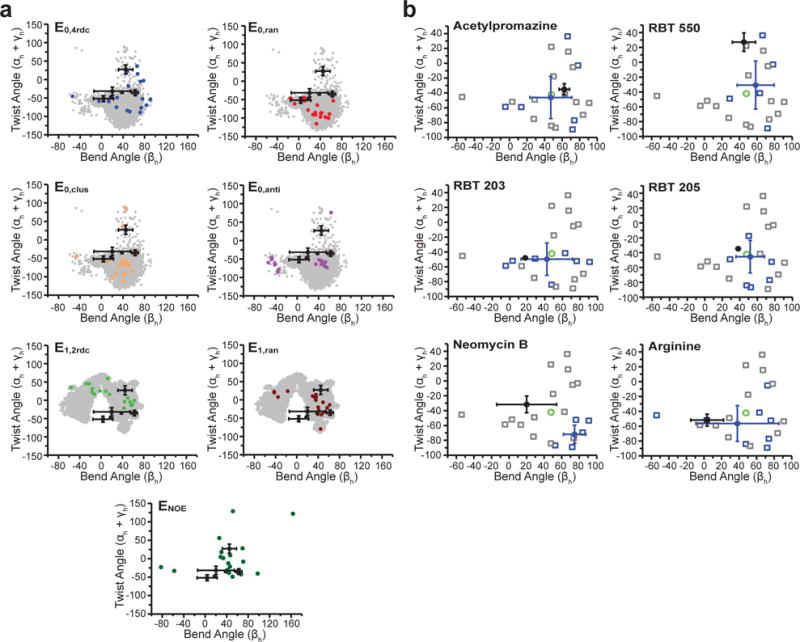
Figure 4.

Assessing EBVS-predicted small molecule bound TAR conformations. a. Inter-helical bend (βh) and twist (αh+γh) angles59 (negative and positive twist angles correspond to over- and under-twisting, respectively) for each TAR ensemble (colored) compared to its respective parent MD pool (gray) and all ligand-bound TAR NOE-based NMR structures (black, mean and s.d. values over all deposited structures). b. For each small molecule, the inter-helical angles of the ligand-bound NMR structures (black, mean and s.d. values over all deposited structures) are compared to the conformers of the E0,4rdc ensemble (open squares), the average values over all conformers (green), the Boltzmann-weighted EBVS-predicted structures (blue circles, mean and s.d. values over n=20 independent docking runs), and all conformers predicted to be > 25% populated over n=20 independent docking runs (blue open squares).
