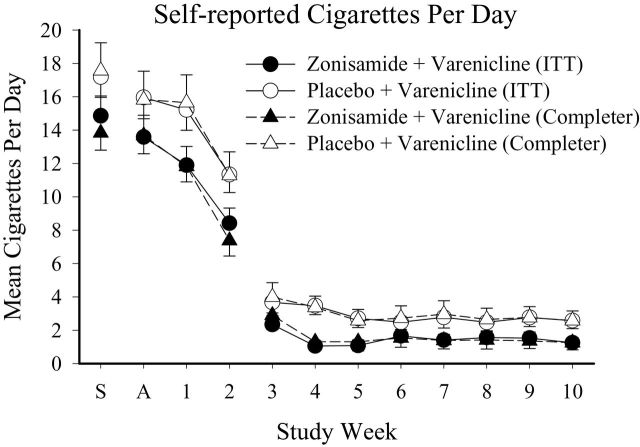
Figure 1.
Self-reported mean number of cigarettes smoked per day. X-axis presents study week; S = Screening, A = Admission to study. The target-quit day was Day 1 of Week 3. Results are presented as a function of intent-to-treat (ITT) (circle) and completer (triangle) analyses, and as a function of the Zonisamide + Varenicline (filled) and Placebo + Varenicline (open) groups. Error bars represent standard error of the mean ( SEM ).

