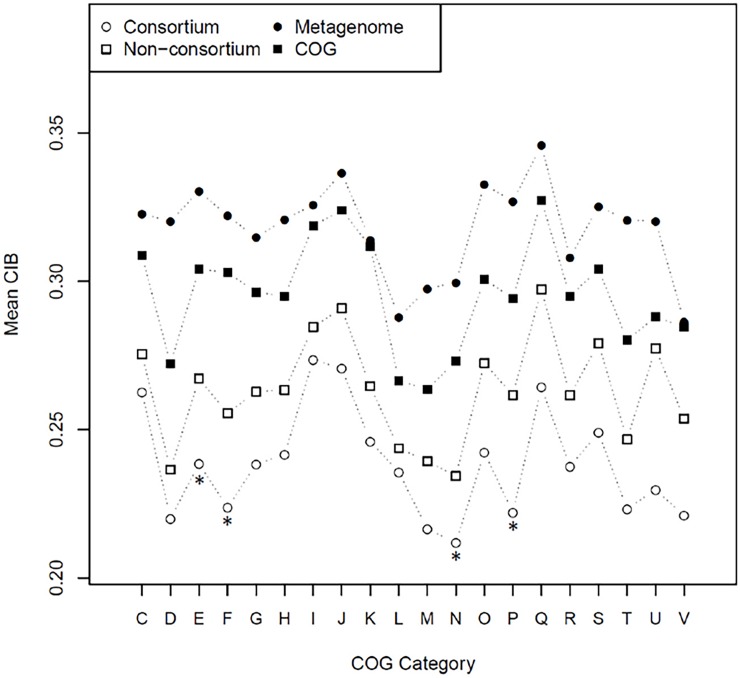
Fig 1. Average value of CIB for genes belonging to the consortium biomining species and the selected comparison groups under study.
Each value is the average CIB calculated over all the species from each independent group classified according to COG category. The asterisks mark the four COG categories for which the greatest difference was observed between the mean CIB for the consortium and the mean CIB for the 2014 COG database.

