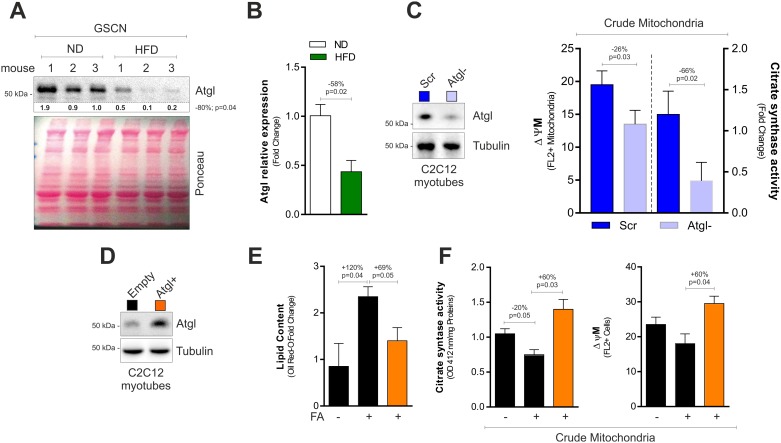
Fig 2. Atgl controls mitochondrial functionality in muscle cells.
(A) Western blot analysis of Atgl in total homogenates of GSCN of mice fed with normal diet (ND) or high fat diet (HFD). Immunoblots reported are representative of three mice per group out of five giving similar results. Below are reported the densitometric analyses of the immunoreactive bands normalized to Ponceau staining (entire line). (B) mRNA expression analysis in gastrocnemius (GSCN) upon treatment with HFD. (C) Western blot analysis of Atgl in C2C12 myotubes transfected with a siRNA against Atgl (Atgl-) or with a scramble siRNA (Scr) (left panel). Immunoblots reported are representative of one experiment out of three giving similar results. Tubulin was used as loading control. Measurement of mitochondrial membrane potential (ΔΨM) and citrate synthase activity in crude mitochondrial fractions of Atgl- C2C12 myotubes (right panel). (D) Lipid content measured by Oil Red O staining (right panel) in C2C12 myotubes transfected with the Atgl cDNA (Atgl+) or with empty vector (Empty) and treated with 300 μM palmitic acid (PA) for 72h. Atgl immunoblot (left panel) is representative of three independent experiments giving similar results. Tubulin was used as loading control. (E) Measurement of mitochondrial membrane potential (ΔΨM) in crude mitochondrial fractions of Atgl+ C2C12 myotubes. (F) Measurement of citrate synthase activity in crude mitochondrial fractions of Atgl+ C2C12 myotubes. All data are expressed as mean ±S.D. (n = 5 mice/group). In vitro data are representative of at least three independent experiments. Student’s t-test was used for two groups comparisons (A-C). One-way ANOVA analysis followed by Turkey’s test corrections was used for multiple comparisons (D-F).

