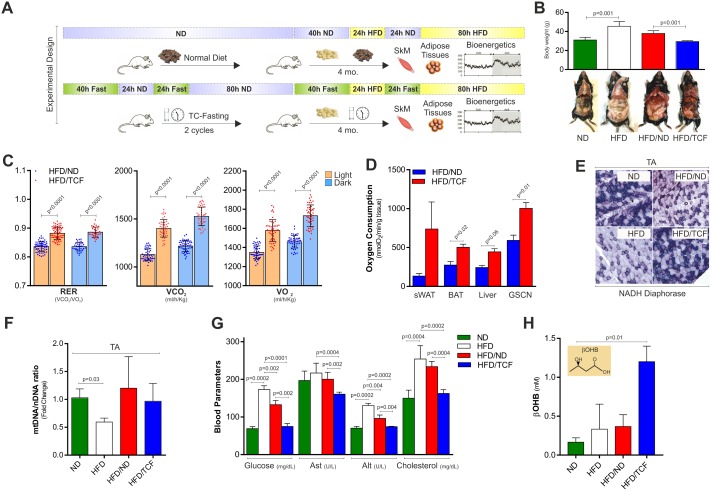
Fig 5. TCF restrains metabolic alterations induced by HFD.
(A) Schematic representation of the dietary interventions. (B) Analysis of body weight in mice fed with ND, HFD, alternating HFD with ND (HFD/ND) or TCF (HFD/TCF) (upper panel). Representative photograph of mice subject to different dietary treatments (bottom panel). (C) RER (VCO2/VO2), oxygen consumption (VO2) and CO2 production (VCO2) were evaluated by metabolic chamber during nocturnal and diurnal periods in HFD/ND and HFD/TCF mice. During measurement both groups were fed with HFD. (D) Basal oxygen consumption measured by a polarographic method in different tissues of HFD/ND or HFD/TCF mice (sWAT: subcutaneous white adipose tissue, BAT: brown adipose tissue, GSCN: gastrocnemius). (E) Evaluation of Complex I activity in TA by NADH diaphorase staining carried out on tissue slices. Representative images from one mice each group were reported. (F) Mitochondrial mass was evaluated by calculating mtDNA/nDNA through qPCR. (G) Analysis of glucose, Ast (aspartate amino transferase), Alt (alanine amino transferase) and cholesterol levels in the serum. (H) Analysis of beta-hydroxybutyric acid (βOHB) in the serum. All data are expressed as mean ±S.D. (n = 5 mice/group). Student’s t-test was used to compare HFD/ND vs HFD/TCF (C, D). One-way ANOVA analysis followed by Turkey’s test corrections was used for multiple comparisons (B, F, G, H).

