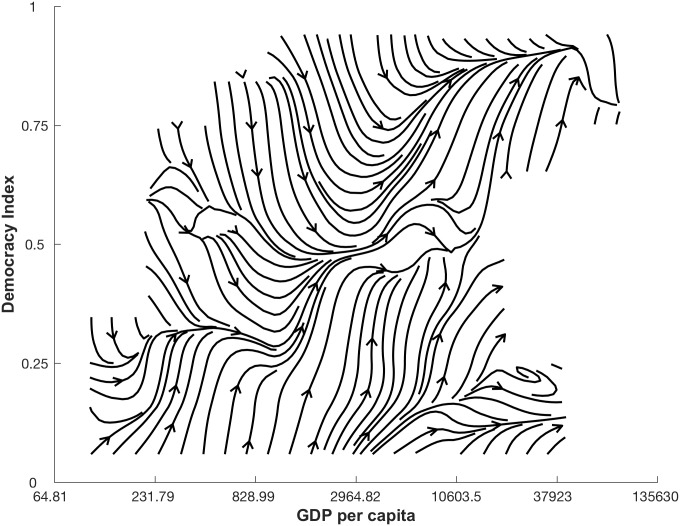
Fig 1. Naive approximation of the non-linear dynamics relationship between democracy (D) and log GDP per capita (G).
The average change of all data points in the G and D directions is calculated in the state space of 100 equally sized regions visualized using an interpolating stream-slice plot. Where there are no lines, there is no data available.

