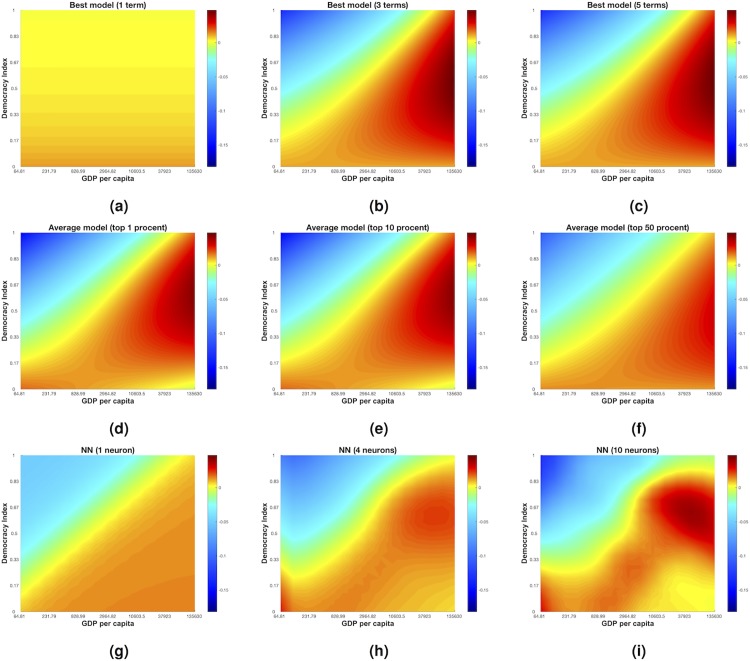
Fig 3. Change in democracy (D).
The three top figures in black (Fig 3 a,b,c) are visualizations of the changes in democracy for best models with one (Fig 3 a), three (Fig 3 b) and five (Fig 3 c) terms. The three figures in the vertical middle (Fig 3 d,e,f) represents 1% (Fig 3 d), 10% (Fig 3 e) and 50% model averaging models. The three figures at the bottom is representations of feedforward neural networks with 1 (Fig 3 g), 4 (Fig 3 h) and 10 (Fig 3 i) neurons in the hidden layer.

