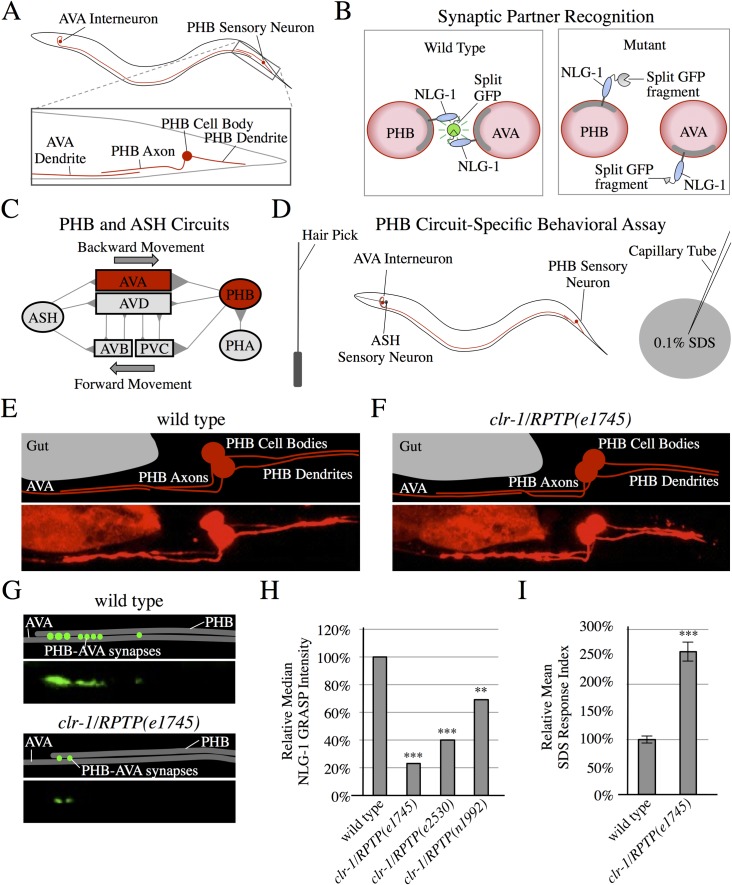
Fig 1. clr-1/RPTP mutants display defective synaptic partner recognition.
(A) Schematic diagrams of PHB and AVA neurons. (B) Schematic diagrams of the trans-synaptic marker NLG-1 GRASP in pre- and postsynaptic neurites (red circles represent cross-sections of neurites in a region with en passant synapses). Split GFPs are linked to the synaptically localized protein NLG-1, so that specific synapses are labeled with green fluorescence in wild-type animals. If a neurite fails to form synapses with the correct partner, NLG-1 GRASP will not reconstitute. (C) Diagram of the PHB and ASH chemosensory circuits including synapses (triangles) connecting sensory neurons (ovals) and interneurons (rectangles) [4, 10, 52]. (D) Outline of a behavioral assay that tests PHB circuit function. Backward movement is induced with a nose touch. Function of PHB-AVA synapses halts backward movement in response to 0.1% SDS. (E and F) Schematics and micrographs of mCherry-labeled PHB neurons and AVA neurites in wild-type (E) and clr-1/RPTP(e1745) mutant animals (F), displaying normal morphology and axon guidance to the ventral nerve cord, followed by anterior projection. (G) Schematics and micrographs of PHB-AVA NLG-1 GRASP in wild-type and clr-1/RPTP(e1745) mutant animals, showing reduced synapses in clr-1/RPTP(e1745) mutant animals. (H) Quantification of NLG-1 GRASP fluorescence demonstrates a reduction in clr-1/RPTP mutant animals including clr-1/RPTP(e1745), clr-1/RPTP(e2530), and clr-1/RPTP(n1992) as compared with wild type (n>80 except for the low-brood size allele e2530, (n = 38)). ***P<0.001, **P<0.01, Mann-Whitney U-test, comparison to wild-type. P-values were adjusted for multiple comparisons using the Hochberg method. 95% confidence intervals for the medians are included in S1 Table. (I) clr-1/RPTP(e1745) mutants display a defect in the behavioral response to SDS (n>75). ***P<0.001, t-test, comparison to wild-type. Error bars are standard error of the mean (SEM).

