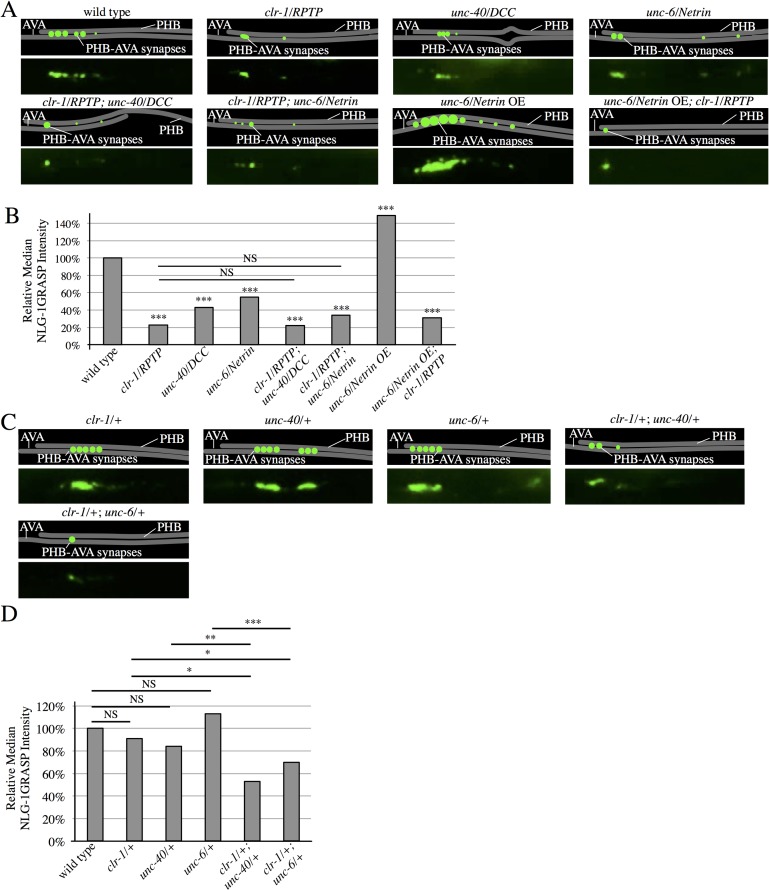
Fig 5. CLR-1/RPTP acts in the UNC-6/Netrin and UNC-40/DCC SPR pathway.
(A) Representative diagrams and micrographs of NLG-1 GRASP fluorescence labeling PHB-AVA synapses in wild-type, clr-1/RPTP(e1745), unc-40/DCC(e271), unc-6/Netrin(ev400), clr-1/RPTP; unc-40/DCC, clr-1/RPTP; unc-6/Netrin, unc-6/NetrinOE, and unc-6/NetrinOE; clr-1/RPTP mutants. (B) Quantification of a reduction in NLG-1 GRASP fluorescence in clr-1/RPTP(e1745), unc-40/DCC(e271), unc-6/Netrin(ev400), clr-1/RPTP; unc-40/DCC, clr-1/RPTP; unc-6/Netrin, and unc-6/Netrin OE; clr-1/RPTP animals, and an increase in NLG-1 GRASP fluorescence in unc-6/Netrin OE animals (n>30). ***P<0.001, U-test, comparison to wild-type. P-values were adjusted for multiple comparisons using the Hochberg method. 95% confidence intervals for the medians are included in S1 Table. (C) Representative diagrams and micrographs of normal levels of NLG-1 GRASP fluorescence labeling PHB-AVA synapses in clr-1 heterozygotes (clr-1/+), unc-40/DCC heterozygotes (unc-40/+), and unc-6/Netrin heterozygotes (unc-6/+), and reduced NLG-1 GRASP fluorescence in trans-heterozygotes with clr-1/RPTP and unc-40/DCC (clr-1/+; unc-40/+), and trans-heterozygotes with clr-1/RPTP and unc-6/Netrin (clr-1/+; unc-6/+). (D) Quantification of NLG-1 GRASP intensity that is not statistically significantly different from wild-type in clr-1/+, unc-40/+, and unc-6/+, and reduced NLG-1 GRASP fluorescence intensity in clr-1/+; unc-40/+ and clr-1/+; unc-6/+ animals. NS, not significant, ***P<0.001, **P<0.01, *P<0.05, U-test. 95% confidence intervals for the medians are included in S1 Table.

