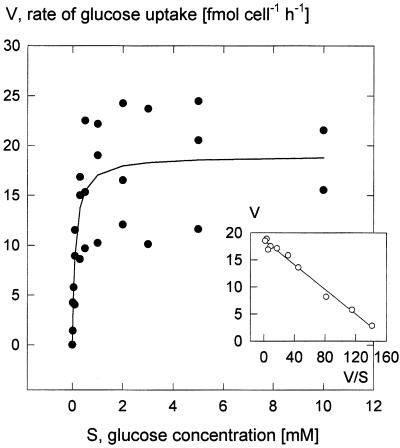
Figure 2.
Concentration dependence of the rate of Glc uptake at pH 5.5 (15-min incubation time). Inset, Eadie-Hofstee plot of the means. Linear regression resulted in an apparent Km of 0.12 mm (ranging from 0.10–0.15 mm among three replications) and a mean Vmax of 19 fmol cell−1 h−1 (12–24 fmol cell−1 h−1).

