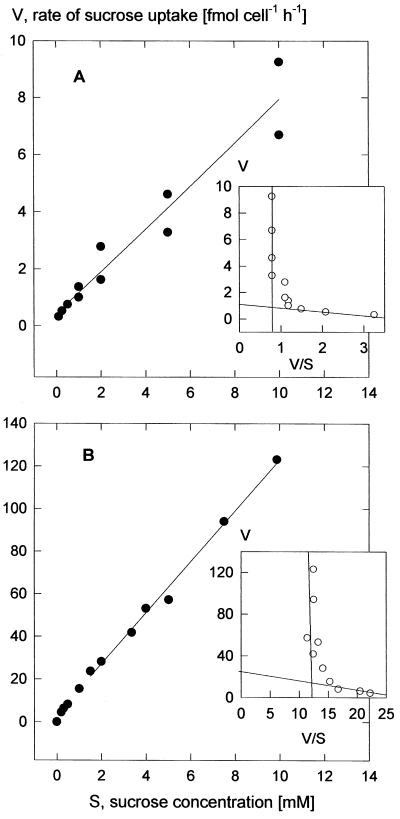
Figure 3.
Concentration dependencies of the rate of Suc uptake at pH 5.5 (30-min incubation time). A, Rates characteristic for the majority of the experiments; B, data from one set of experiments showing particularly high rates. The curves are second-order regressions. The Eadie-Hofstee: plots of the means (insets) bring out the saturating and linear concentration dependencies. Graphs parallel to the ordinates represent the linear components. Linear regression of the data for Suc concentrations <0.5 mm (A) gave apparent Km values between 0.18 and 0.28 mm, with a mean of 0.25 mm (three experiments), and in B for concentrations <1 mm apparent Km values between 0.4 and 1.2 mm, with a mean of 0.8 mm (three experiments).

