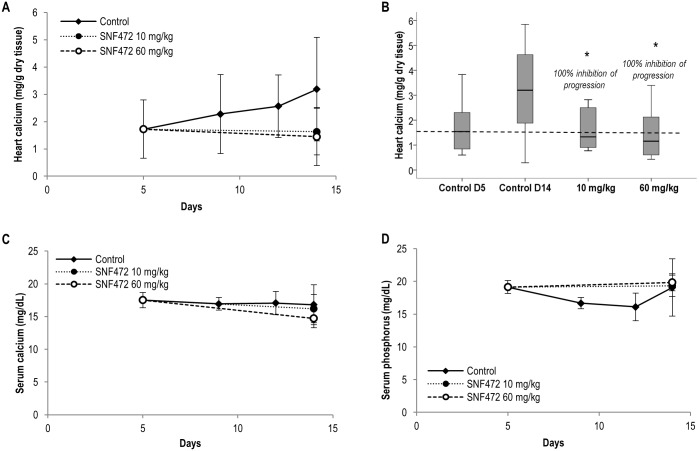
Fig 4. Effects of SNF472 on progression of vitamin D-induced cardiovascular calcification and serum and phosphorus levels in rats.
(A) Heart calcification progression and (B) inhibition by SNF472 after calcification induction via 3 consecutive daily subcutaneous administrations of 100 kIU/kg vitamin D3. The dashed line indicates mean heart calcium levels by day 5 immediately before starting treatment with SN472. (C) Calcium and (D) phosphorus levels in serum of control and SNF472-treated animals. (A, C, D) Results represent mean ± SD. (B) Boxplot representation of the results showing the median (horizontal black bar), Q1 (lower box), Q3 (upper box) and lower and upper limit. Statistical analysis: One-way ANOVA. (*) indicates significant differences vs. control group, p < 0.05 (N = 8 per group).

