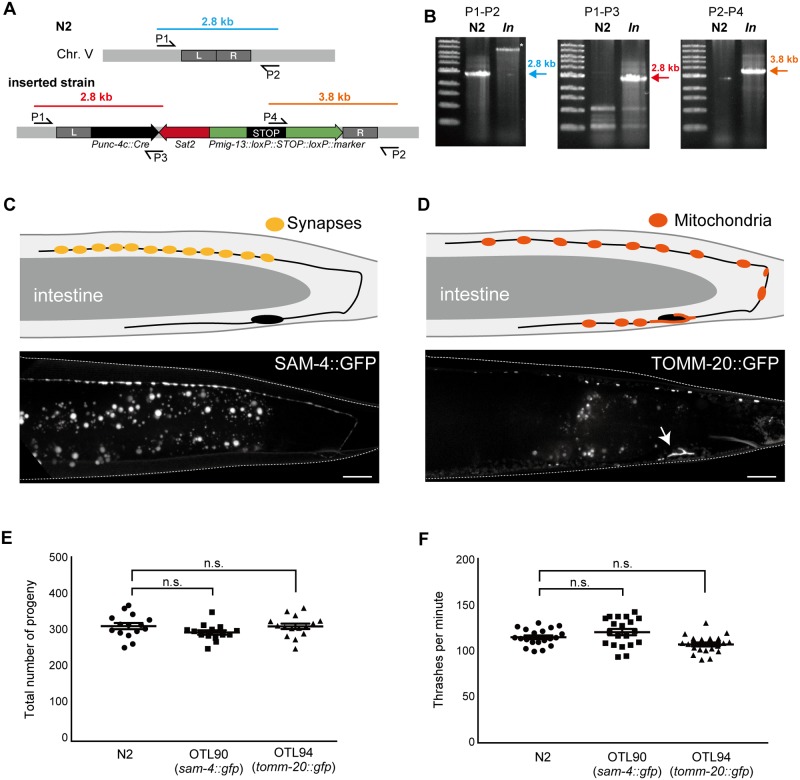
Fig 4. Characterization of the strains obtained by CRISPR/Cas9 and NTC selection.
(A, B) Genomic analysis to confirm that single-copy insertion has occurred. (A) Scheme showing the primers used to characterize the single-copy insertion on chromosome V. In the N2 genome, the P1–P2 primers pair generates a 2.8-kb PCR product (blue). P1–P3 and P2–P4 primer pairs generate a 2.8-kb (red) and a 3.8-kb (orange) band, respectively, in the resultant strains but not in the wild-type strain. (B) Representative results from the worm PCRs. The results are consistent with the genomic analysis shown in panel A. (C) Schematic drawing of the DA9 neuron (upper panel) and a fluorescent image of the synaptic marker, SAM-4::GFP (lower panel). Note that SAM-4::GFP signals are specifically localized at synapses in the dorsal axon. (D) Schematic representation of the DA9 neuron (upper panel) and a fluorescent image of the mitochondrial marker, TOMM-20::GFP (lower panel). Note that mitochondria are localized in the cell body (arrow) and axons. Dendritic localization is relatively weak. Bars = 10 μm. (E) Total number of progeny. Statistical significance was determined by Dunnett’s test, n = 15 (N2), = 14 (OTL90) and = 15 (OTL94). n.s., statistically not significant. Compared to wild type. (F) Body bending was measured for 1 min, after 1 min adaptation of the worms in M9 buffer. Statistical significance was determined by Dunnett’s test. Twenty worms were counted for all the strains. n.s., statistically not significant. Compared to wild type.

