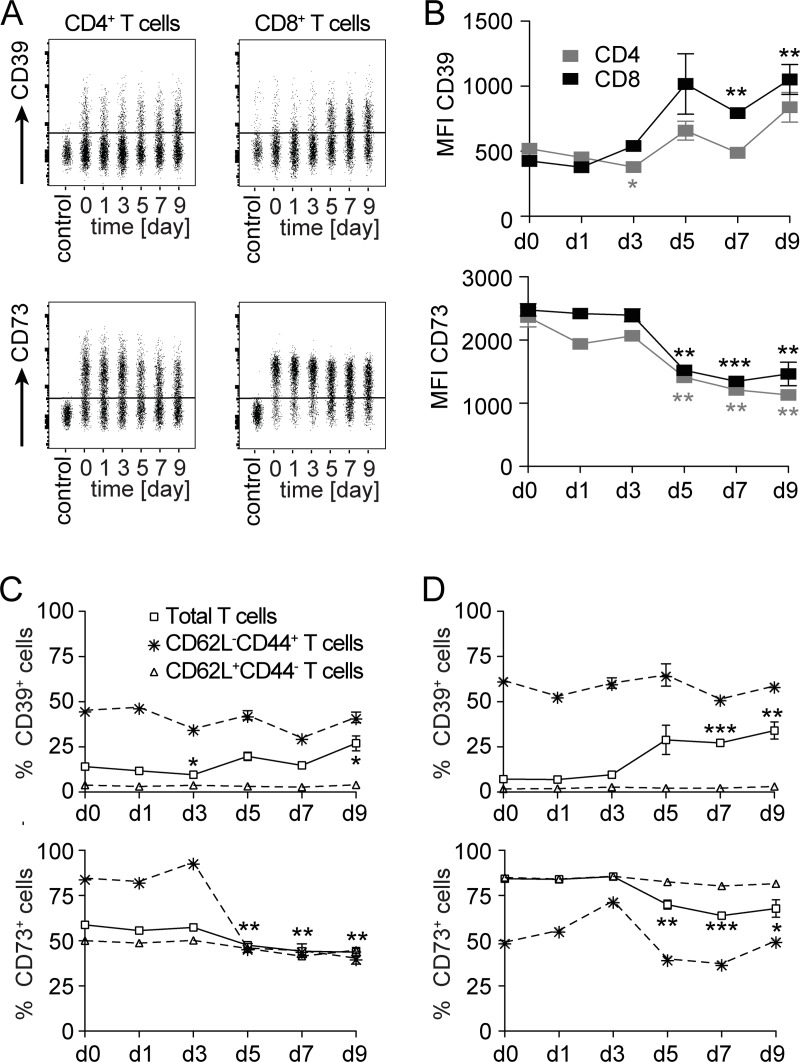
Fig 4. CD39 and CD73 expression profiles of T cells during the course of L. monocytogenes infection.
Wildtype mice were i.v. infected with 1×10⁵ LmOVA. At indicated time points, surface expression of CD39 and CD73 was analyzed on CD4+ and CD8+ T cells from spleens. (A) Representative concatenated dot plots for CD39 and CD73 expression on CD4 and CD8-gated cells. CD39 staining was controlled with cells from CD39-/- mice, CD73 staining with an isotype control. (B) MFI of CD39 and CD73 staining on CD4 and CD8-gated cells. (C, D) Percentages of CD39+ and CD73+ cells among CD4+ (C) and CD8+ T cells (D). Shown are %-values for total, for CD62L+CD44— and for CD62L—CD44+ T-cell populations (see S1 Fig for gating strategy and cell numbers). Values in B-D give the mean ± SEM for three independently analyzed mice per time point and are representative for three independent experiments. Unpaired t test, comparison with day 0 (in C and D only shown for total T-cell populations), * p<0.05, ** p<0.01, *** p<0.001.

