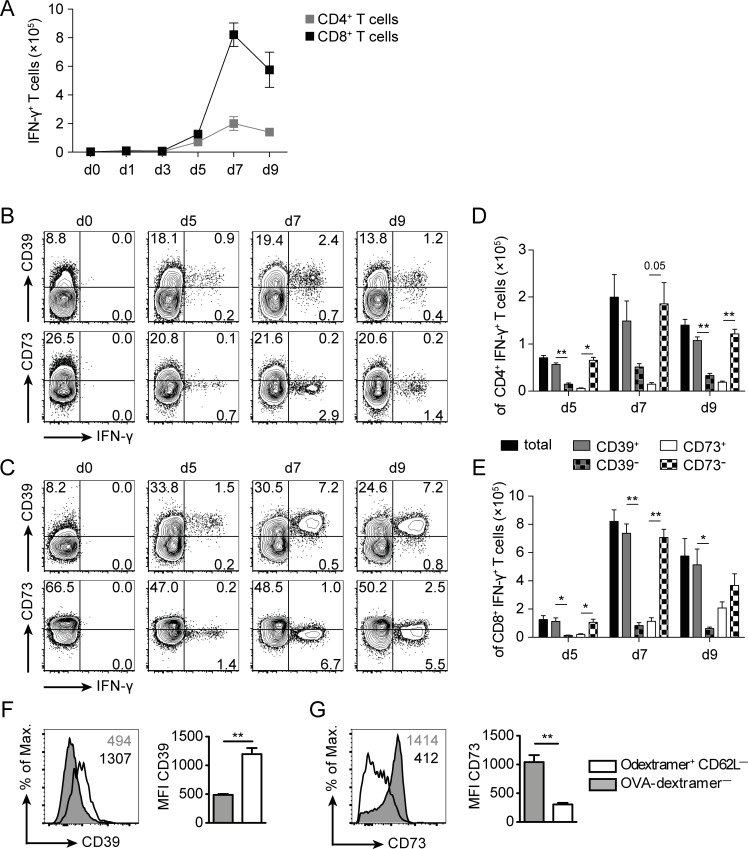
Fig 5. CD39 and CD73 expression profiles of listeria-specific T cells.
Wildtype mice were i.v. infected with 1×10⁵ LmOVA. (A-E) Spleens cells were isolated at the indicated time points and stimulated with LLO189-201 and OVA257-264 peptides for 4h, and then analyzed for expression IFN-γ and CD39 or CD73. Responding T cells were identified by intracellular IFN-γ staining. (A) Numbers of CD4+ and CD8+ T cells per spleen responding to peptide stimulation with IFN-γ production. Representative FACS plots of CD4 (B) and CD8-gated cells (C). Numbers give the %-values for quadrants. Numbers of total, CD39+, CD39—, CD73+, and CD73—cells for IFN-γ+ CD4+ (D) and for IFN-γ+ CD8+ T cells (E). Bars give the mean ± SEM. Representative results of CD39 (F) and CD73 expression (G) on OVA257-264-dextramer+ CD8+ T cells at d9 post infection. Open histograms show dextramer+ and filled histograms dextramer—CD8+ T cells. Numbers give the MFI. Bars give the mean ± SEM. Results are representative for at least two independent experiments with three or five individually analyzed mice per group and time point. Paired t test, * p<0.05, ** p<0.01.

