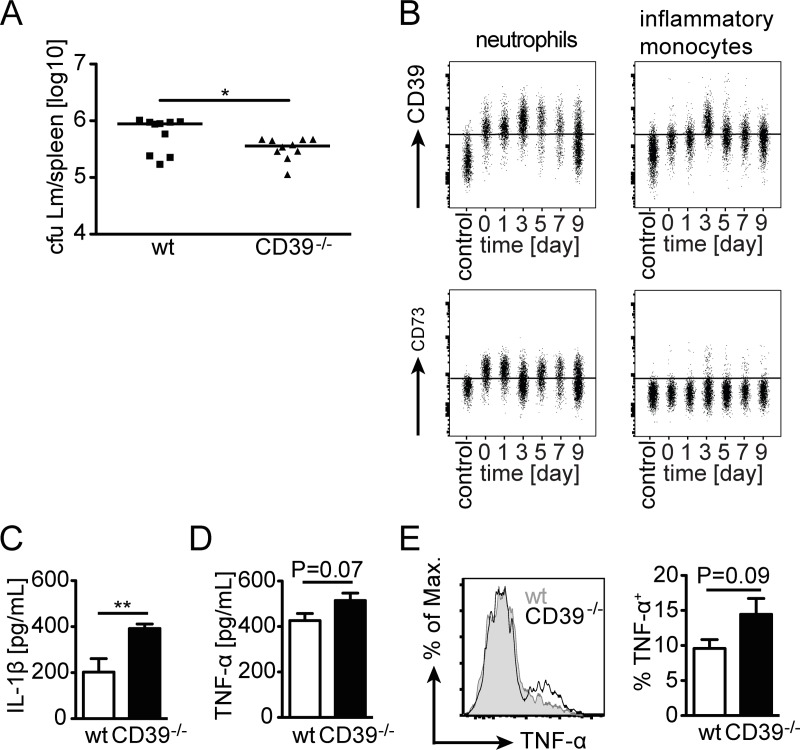
Fig 6. Innate response of CD39-/- mice against L. monocytogenes.
Wildtype and CD39-/- mice were i.v. infected with 5×10³ Lm. (A) Bacterial burden in spleens was determined at d2 post infection. Combined results for 10 individually analyzed mice from two independent experiments and the median are shown. cfu, colony forming units. Mann Whitney test, * p<0.05. (B) Wildtype mice were infected with 1×10⁵ LmOVA. At the indicated time points, neutrophils and inflammatory monocytes from the spleen were analyzed for the expression of CD39 and CD73 by flow cytometry. Representative concatenated dot plots for surface expression of CD39 and CD73 on neutrophils and inflammatory monocytes are shown. (See S2 Fig for mean values for groups of mice.) (C, D) Spleen cells from wildtype and CD39-/- mice were cultured with Lm overnight. Supernatants were collected and the concentration of IL-1β (C) and TNF-α (D) was determined by ELISA. Bars present the mean ± SEM of eight values. (E) Wildtype and CD39-/- mice were i.v. infected with 5×10³ Lm. On day 2 post infection, spleen cells were isolated and expression of TNF-α was directly analyzed in inflammatory monocytes by intracellular cytokine staining and flow cytometry. Representative histograms and frequency of TNF-α+ inflammatory monocytes are given. Bars present the mean ± SEM of five individually analyzed mice. Results are representative for two independent experiments. Unpaired t test, ** p<0.01.

