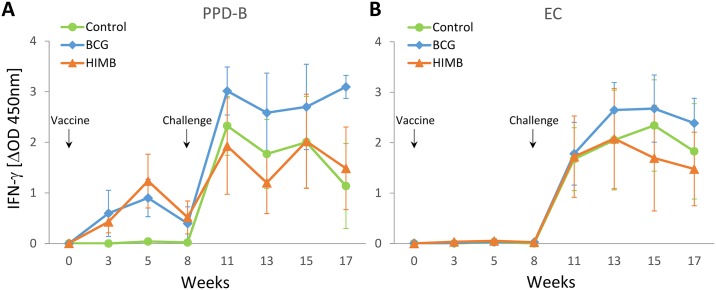
Fig 2. Antigen specific IFN-γ responses after vaccination and M. caprae challenge.
The graphic shows the levels of IFN-γ measured by ELISA. Results are expressed as ΔOD450mn ± 95% CI. (A) Response against Bovine tuberculin (PPD-B). (B) Response against EC antigen cocktail (ESAT-6 / CFP-10). Groups: Control (n = 8), BCG (n = 8), HIMB (n = 7).

