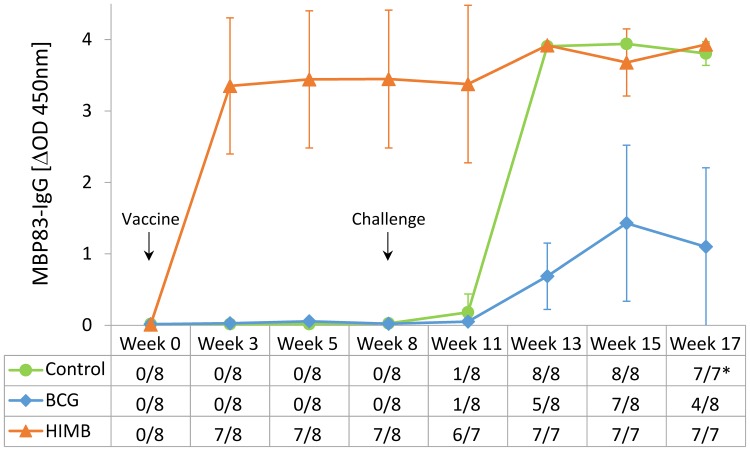
Fig 3. Antibody responses to MPB83 after vaccination and challenge.
The graphic shows the MPB83-IgG levels measured by ELISA. Results are expressed as ΔOD450mn ± 95% CI. Groups: Control (n = 8), BCG (n = 8), HIMB (n = 7). The table in the horizontal axis represents the qualitative results of the test (No. of seropositive goats/total goats).*One goat of the control group was euthanized at week 16.

