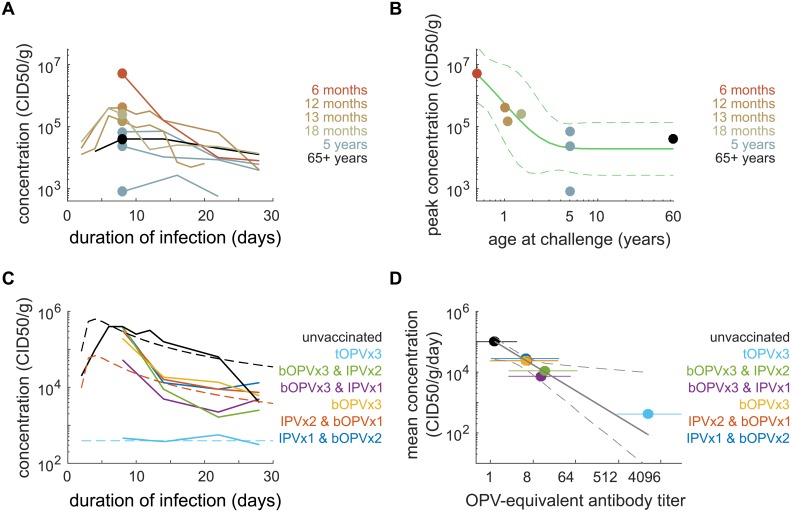
Fig 2. Concentration of poliovirus in stool: effects of age and immunity.
(A) Mean concentration of polivirus in stool (CID50/g) versus time after OPV challenge for immunologically naive subjects (color by age at challenge). (B) Peak concentration depends on age (dot color by age at challenge, corresponding to data from panel A at 1 week post-challenge; green line, model MLE and 95% CI, S1 Text Eq B). (C) Mean concentration after mOPV2 challenge for subjects with various vaccination histories (dashed, model MLE; solid, trial data age adjusted to 12 months using S1 Text Eq C). The concentration of poliovirus in stool depends on pre-challenge vaccination history. (D) The mean daily concentration (culture infectious doses per gram per day; CID50/g/day) declines by one order of magnitude for every 8-fold increase in OPV-equivalent antibody titer (OPV-equivalent titers [color, MLE, and 95% CI] for each trial arm shown in panel C; black, model [S1 Text Eq D, MLE, and 95% CI]). Interactive data visualization is available at https://famulare.github.io/cessationStability/. CI, confidence interval; CID50, the culture infectious dose that induces a cytopathic effect in 50% of infected cell or tissue cultures; IPV, inactivated polio vaccine; MLE, maximum likelihood estimate; mOPV, monovalent OPV; OPV, oral polio vaccine; tOPV, trivalent OPV.

