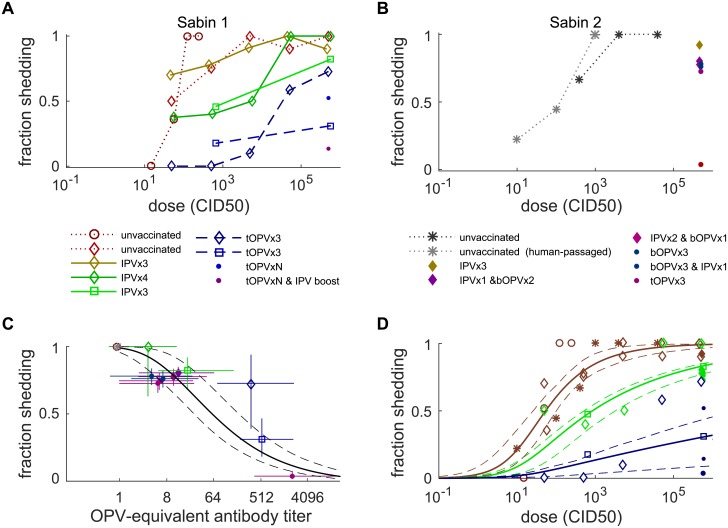
Fig 3. Oral susceptibility to infection after OPV challenge.
(A) Fraction shedding after Sabin 1 oral challenge at different doses (color by trial arm, symbol by source study). (B) Fraction shedding after Sabin 2 oral challenge at different doses (color by trial arm, symbol by source study; data for doses ≤103 CID50 are for human-passaged Sabin 2 isolated from stool 5 days after vaccination). (C) Fraction shedding at vaccine doses (105–6 CID50) decreases with increasing OPV-equivalent antibody titer (color and symbols as in panels A–B; black lines are model MLE and 95% CI using S1 Text Eq E). (D) Beta-Poisson dose–response model MLE and 95% CI. Three model scenarios shown correspond to immunologically naive (NAb = 1, red), heterotypic bOPV and upper-bound IPV-only (NAb = 8, green), and typical tOPV or post-IPV-boosting (NAb = 256, blue). Data from panels A–B (symbols as above, colored by corresponding model scenario). bOPV, bivalent type 1 and 3 OPV; CI, confidence interval; CID50, the culture infectious dose that induces a cytopathic effect in 50% of infected cell or tissue cultures; IPV, inactivated polio vaccine; MLE, maximum likelihood estimate; OPV, oral polio vaccine; tOPV, trivalent OPV.

