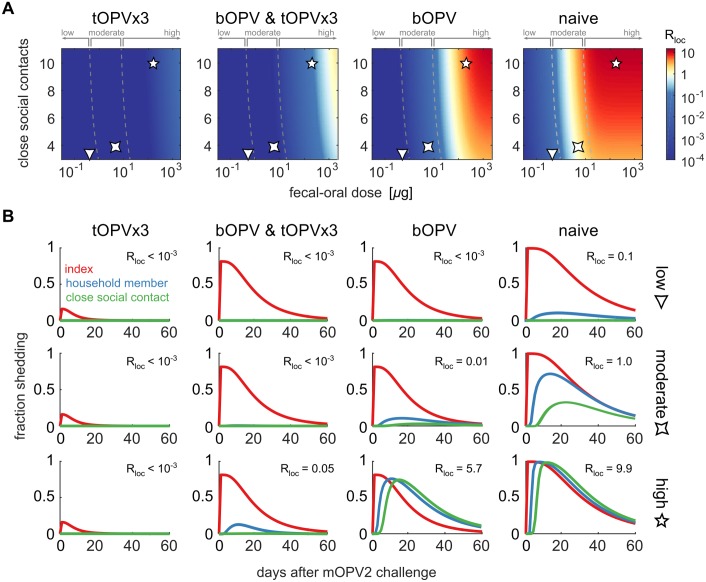
Fig 10. The effects of vaccination policy on Sabin 2 transmission for four immunity scenarios: tOPV×3 (index and household/social contact NAb = 512), bOPV and tOPV×3 (index NAb = 512 and household/social contact NAb = 256), bOPV (index NAb = 8 and household/social contact NAb = 2), and naive (index and household/social contact NAb = 1).
(A) Local reproduction number versus fecal–oral dose and number of close social contacts (color map, Rloc; dashed lines, transmission rate category boundaries from Fig 8B; symbols, example low, moderate, and high transmission rate settings). (B) Maximum likelihood estimates of the fraction shedding for each subject type after mOPV2 challenge in young index children, for each immunity scenario and example transmission rate setting in panel A. bOPV, bivalent type 1 and 3 OPV; mOPV, monovalent OPV; tOPV, trivalent OPV.

