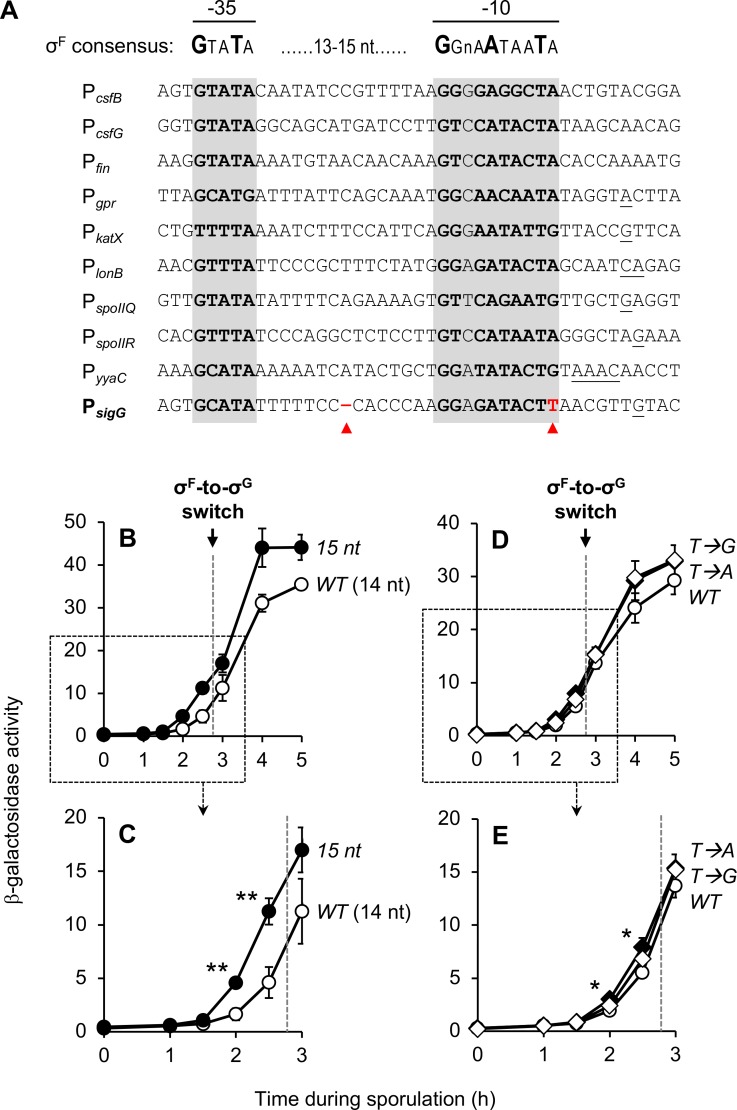
Fig 4. Suboptimal spacing of the PsigG -10 and -35 elements diminishes sigG expression.
(A) Alignment of ten B. subtilis promoters activated by σF, including PsigG. Nucleotides comprising the -10 and -35 elements of each promoter are in bold and shaded gray. Transcription start sites, if known, are underlined [41]. The consensus promoter sequence for σF is shown above [38]. Red arrowheads indicate two notable features of PsigG that differ from the other σF-target promoters: shorter spacing of the -10 and -35 promoter elements (14 nt as opposed to the more common 15 nt; left arrowhead), and a T at position -7 (more typically an A or G; right arrowhead). (B, C) PsigG activation is significantly stimulated by increasing the spacing between the -10 and -35 elements to 15 nt. β-Galactosidase production was monitored during sporulation of strains harboring PsigG-lacZ (WT [14 nt]; open circles) and 15ntPsigG-lacZ (15 nt; closed circles), a variant in which a single nucleotide was inserted between the PsigG -10 and -35 elements to increase their spacing to 15 nt. (Strains JJB31 and JJB51, respectively.) Note that (C) provides a zoomed view of the data from the boxed area of (B). (D, E) The T at position -7 at most only modestly influences PsigG activation. The activity of PsigG-lacZ (WT; closed circles),T→APsigG-lacZ (T→A; closed diamonds), and T→GPsigG-lacZ (T→G; open diamonds) was measured during sporulation. (Strains JJB31, JJB87, and JJB89, respectively.) The T→A and T→G variants were engineered to harbor an A or G, respectively, at position -7 in place of T. Note that (E) provides a zoomed view of the data from the boxed area of (D). The timing of the σF-to-σG switch, between sporulation hours 2.5 and 3, is indicated in each panel by a dashed gray line. For all relevant panels, error bars indicate ± standard deviations based on three independent experiments. *p < 0.05, **p < 0.01 Student’s t-test.

