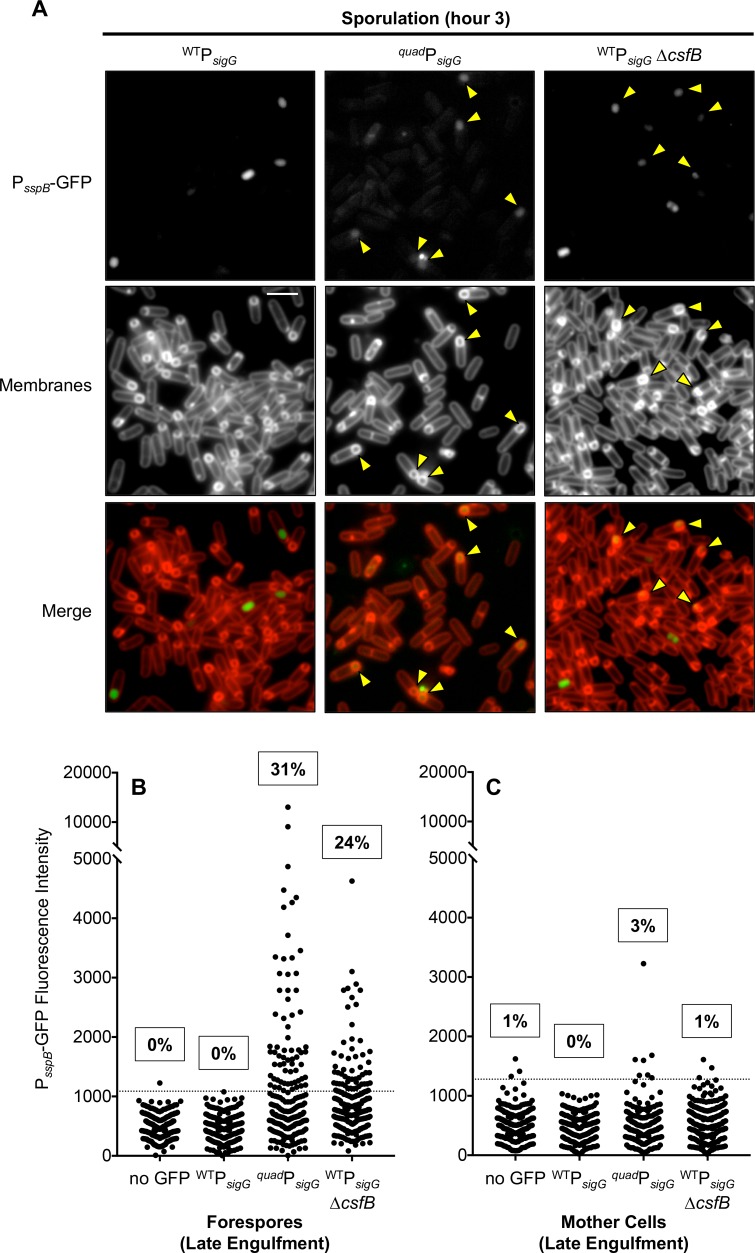
Fig 8. Misexpression of sigG causes premature σG activity in the forespore during sporulation.
GFP production from a σG-dependent PsspB-gfp reporter was monitored by fluorescence microscopy of sporulating cells (hour 3.5) in which sigG was expressed from its wild type regulatory sequences (WTPsigG) or from regulatory sequences modified to remove or repair the four features identified in this study to dampen sigG expression (quadPsigG). Additionally, cells either harbored wild type csfB, or were deleted for the gene (ΔcsfB). (Strains EBM192 [WTPsigG], EBM276 [quadPsigG] and EBM282 [WTPsigG ΔcsfB].) (A) Representative microscopy images for each strain. GFP fluorescence is depicted in grayscale (PsspB-GFP) or false-colored green (Merge). Membrane fluorescence from the dye FM 4–64 is shown in grayscale (Membranes) or false-colored red (Merge). Following asymmetric division and during engulfment, the FM 4–64 dye labels all membranes including the double membranes separating the mother cell and forespore; after the completion of engulfment, the membranes surrounding the forespore are no longer accessible to the dye and therefore remain unlabeled. Yellow arrowheads indicate late engulfment forespores, identifiable by their FM 4-64-labeled engulfing membranes, with visible GFP fluorescence. Scale bar 5 μm. (B) GFP fluorescence intensity (with background subtracted) for more than 200 late-engulfment forespores or (C) their corresponding mother cells for the three strains described in (A) as well as a “no GFP” control strain (PY79) lacking the PsspB-gfp reporter are shown in column scatter graph format, with each cell represented by a black dot. Cells exhibiting fluorescence intensity above the cut off value (three standard deviations above mean auto-fluorescence of the “no GFP” strain; gray dashed line) were determined to have detectable σG activity. The percentage of cells with this activity is noted above the respective strain.

