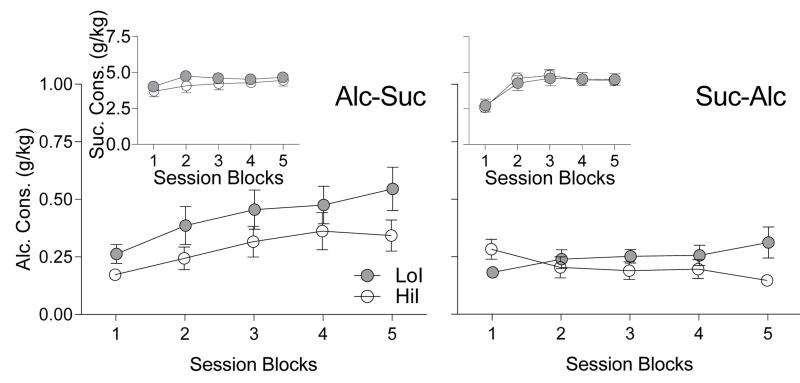
Fig. 4.
Mean alcohol consumed (g/kg) in LoI and HiI rats across session blocks. Insets depict mean sucrose consumed (g/kg). Error bars represent SEM. Depicted are rats from Alc-Suc and Suc-Alc orders (left and right panels, respectively; n = 15 each group, each panel). Each data point represents the mean of four sessions.

