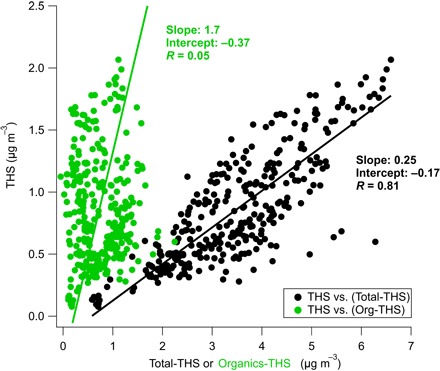
Fig. 3. Correlation of THS with indoor aerosol components.

The black dots show the scatter plot of the concentration of the THS factor versus the total indoor aerosol minus THS factor. The green dots show the scatter plot of THS factor concentration versus the indoor organic aerosol minus the THS factor.
