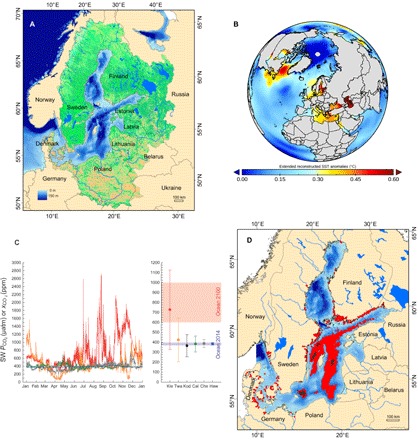
Fig. 1. The Baltic Sea time machine.

(A) The Baltic Sea, its neighboring countries, and the catchment area. (B) Sea surface temperature (SST) change per decade since 1980. The Baltic Sea is at the center of the map. (C) Left: High-resolution surface seawater CO2 variability in 2014 at a coastal Baltic Sea site (Kiel Fjord Time Series, 54.2°N, 10.9°E; red symbols) in comparison to an oceanic site close to Hawai’i (Woods Hole—Hawaii Ocean Time-series Site, 22.7°N, 157.9°W; blue symbols) and coastal sites in Florida (Cheeca Rocks, 24.9°N, 80.6°W), California [California Current Ecosystem Mooring 2 (CCE2), 34.3°N, 120.8°W; green symbols], Alaska (Kodiak, 57.7°N, 152.3°W; black symbols), and Washington (Twanoh, 47.4°N, 123°W; orange symbols). Right: Mean Pco2/xco2 values and SD for 2014 data from selected time series stations (see above). All data are seawater (SW) Pco2 (in microatmospheres) except for station Twanoh [xco2, in parts per million (ppm), dry]. Kie, Kiel; Twa, Twanoh, Kod, Kodiak; Cal, CCE2; Che, Cheeca Rocks; Haw, Hawai’i. (D) Expansion of hypoxic zones in the Baltic Sea during 115 years of monitoring. Black shading shows the situation for the period 1900–1910, whereas red shading indicates the period 2001–2010. Coastal hypoxia is depicted by red dots. For data sources, see data S3.
