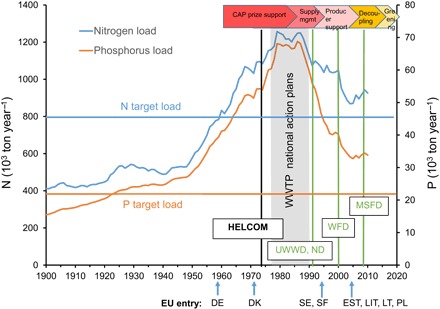
Fig. 4. Nutrient input into the Baltic Sea.

Five-year moving average values of N and P loads (in 1000 metric tons per year) to the Baltic Sea together with the BSAP targets. Along the x axis, the timing of countries joining the EU and the introduction of key EU environmental legislation are shown. WWTP, wastewater treatment plans; HELCOM, signing of the Helsinki Convention; UWWD, urban wastewater directive. Key developments of the EU CAP are indicated by arrows at top of the diagram. Supply mgmt, supply management; DE, Germany; DK, Denmark; SE, Sweden; FI, Finland; EST, Estonia; LIT, Lithuania; LT, Latvia; PL, Poland. For detailed references and sources, see data S3.
