
Fig. 3. Temporal variation of biological and sedimentological proxies.
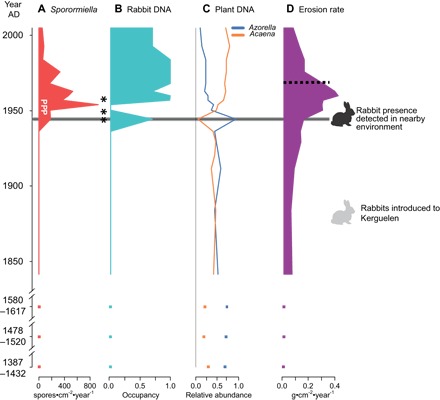
(A) accumulation rate of spores of coprophilous fungi (Sporormiella spp.; influx), occurrence of Podospora spp. (P), and multicellular ascospores of Sporormiella (*). (B) Rabbit sedDNA. (C) sedDNA of plants (proportion). (D) Erosion rate. Dashed lines represent the abrupt changes detected by regression tree and breakpoint analysis.