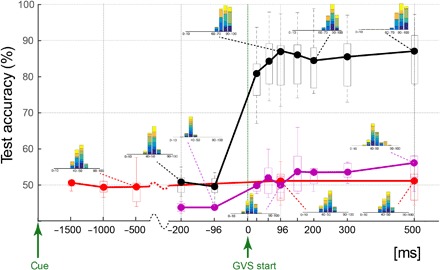
Fig. 2. Decoding performance summary.

The across-participant median decoding performance when decoding for the direction in which a participant wants to turn (that is, the cue direction) is shown in red and pink, whereas decoding for a MATCHED/MISMATCHED participant intention and applied GVS is shown in black. The data at each time point represent the decoding performance using data from the time period between a reference point (“cue” for red data and “GVS start” for pink and black data) and that time point. Box plot boundaries represent the 25th and 75th percentile, whereas the whiskers represent the data range across participants. The inset histograms show the participant ensemble decoding performance in the 140 (20 test trials × 7 participants) test trials, with each participant data shown in a different color.
