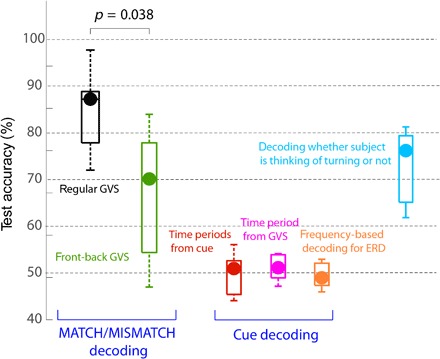
Fig. 3. Summary of decoding performance from various analyses in the 96-ms time period.

The MATCHED/MISMATCHED decoding with GVS is shown in black. On applying the GVS in the front-back configuration (green data), the decoding performance decreased. Decoding for cue direction, using either all the data since the cue (red data) or data since the GVS start (pink), did not show performance above chance. Decoding performance was similarly low using frequency features between 0.01 and 30 Hz, typical of ERD-based decoders (orange), indicating that our task (imaging turning right or left) did not initiate significant ERD differences in participants. Finally, the decoding of whether the participant was thinking of turning or not (cyan) was also observed to be significant after GVS.
