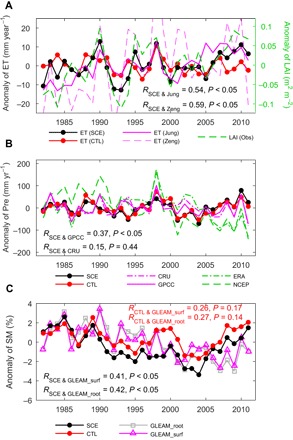
Fig. 2. Temporal changes of the anomalies in annual hydrological variables over China from 1982 to 2011.

(A) ET, (B) precipitation (Pre), and (C) relative soil moisture (SM). The black line represents the ensemble (15 members) mean from the experiment (“SCE”), and the red line denotes that from the control (“CTL”) (Materials and Methods). The solid magenta (gray) and dashed green lines denote the observations or observation-based data sets, that is, LAI from Global Inventory Modeling and Mapping Studies (GIMMS) (51); observation-based ET products from Jung et al. (59) and Zeng et al. (60); observed precipitation from data sets of the Climate Research Unit (CRU) (61) and the Global Precipitation Climatology Centre (GPCC) (62) and precipitation output from the European Centre for Medium-Range Weather Forecasts (ECMWF) reanalysis (ERA-Interim) (65) and National Centers for Environmental Prediction (NCEP) reanalysis data set (66); observation-based soil moisture data from the output of the GLEAM (64) presented by surface soil moisture (GLEAM_surf) and root-zone soil moisture (GLEAM_root). The correlation coefficients and P values are shown for the relations between simulations and observations.
