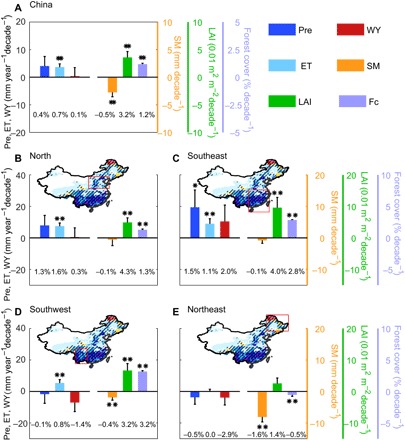
Fig. 3. Linear trend of vegetation-induced changes (that is, SCE − CTL) in annual hydrological variables (including Pre, ET, Pre − ET, and total SM) and the trend in observed LAI and forest cover (Fc).

(A) The whole country, (B) North China, (C) Southeast China, (D) Southwest China, and (E) Northeast China. The spatial extent of each region is shown on the map above each subplot. One asterisk indicates statistical significance at the 90% confidence level, and two indicate statistical significance at the 95% confidence level.
