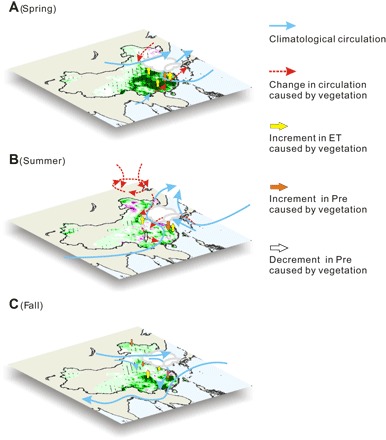
Fig. 4. Schematic diagram of the vegetation biophysical feedback to ET, precipitation, and low-level (that is, 700 hPa) tropospheric circulation.

(A) Spring (March to May), (B) summer (June to August), and (C) fall (September to October). The base map shows the trend in changes of the satellite-observed LAI during the corresponding season from 1982 to 2011. Blue solid arrows denote the climatological wind fields in the low-level troposphere. The red dashed arrows are the significant trend of the low-level troposphere composited wind fields caused by vegetation changes (that is, experiment − control: SCE − CTL), which was summarized from the spatial pattern of significant change in circulation such as fig. S10. Arrows denoting vegetation-induced changes in ET and Pre were drawn only when the trend was significant in at least 1 month of the corresponding season according to fig. S8 (B and C).
