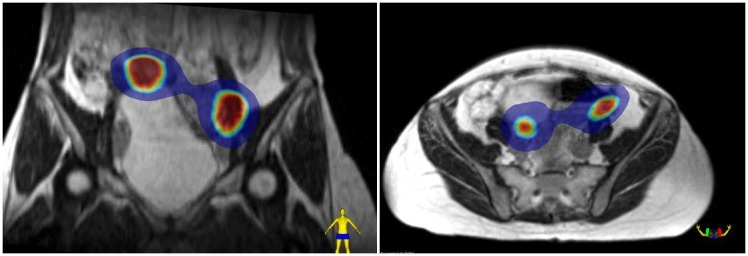
Figure 3. The cumulative dose distribution.

A coronal and axial view of dose accumulation of both treatments projected on the first simulation magnetic resonance (SIM MR) scan.
Blue color wash = 4Gy. Inner red color wash = 8 Gy.

A coronal and axial view of dose accumulation of both treatments projected on the first simulation magnetic resonance (SIM MR) scan.
Blue color wash = 4Gy. Inner red color wash = 8 Gy.