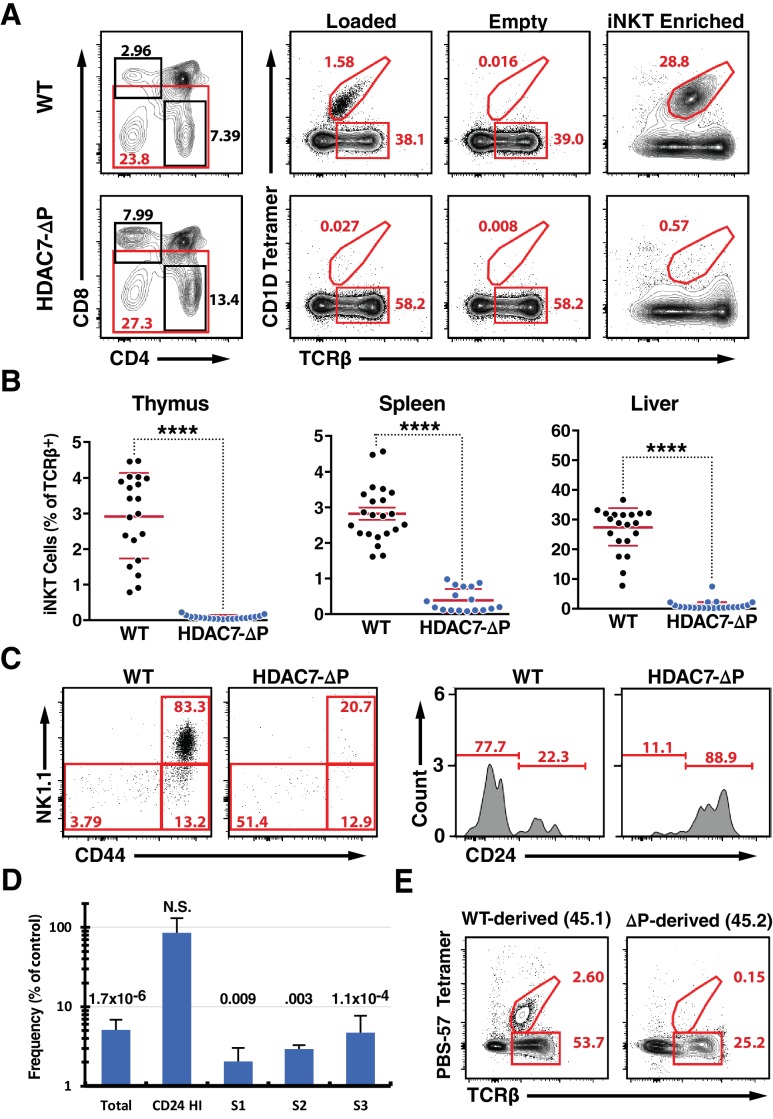
Figure 1. A Gain-of-Function HDAC7 Mutant, HDAC7-ΔP, Arrests Thymic iNKT Development.
(A) Representative flow cytometric plots of iNKT cells and conventional αβ T-cells, identified by staining with TCRβ and CD1D tetramer, empty or loaded with αGalCer as indicated, in thymocytes from WT (top) and HDAC7-ΔP (bottom) mice. Staining after magnetic enrichment of 2 × 10⁷ cells with loaded tetramer is shown at right. (B) Quantification of iNKT cell frequency in Thymus (left), spleen (center), and liver (right) of WT (black symbols) and HDAC7-ΔP (blue symbols) mice (C) Representative flow plots showing conventional staging of iNKT development by CD44 and NK1.1 expression (left) and CD24 expression (right) in magnetically enriched Tet+ TCRβ+ thymic iNKT cells from WT and HDAC7-ΔP mice as indicated. (D) Quantification of difference in frequency of magnetically enriched iNKT cells at the indicated stages, as defined in (C), for five littermate pairs WT and HDAC7-ΔP mice. Difference is expressed as (% of live cells / % of live cells) * 100 for HDAC7-ΔP/WT. Numbers above each column indicate P-value by 2-tailed Student’s T-test. (E) Representative flow cytometric plots and of iNKT from thymus in WT (CD45.1): HDAC7-ΔP (CD45.2) mixed bone-marrow chimeras. Data in (B) are combined from eight independent experiments involving 1–3 littermate pairs; data in (C) are representative of 5 WT: HDAC7-ΔP littermate pairs. Data in (E) are representative of 3 sets of chimeras with 3–6 mice per group. Statistical significance was determined using unpaired two-tailed t tests; ****p≤0.0001.


