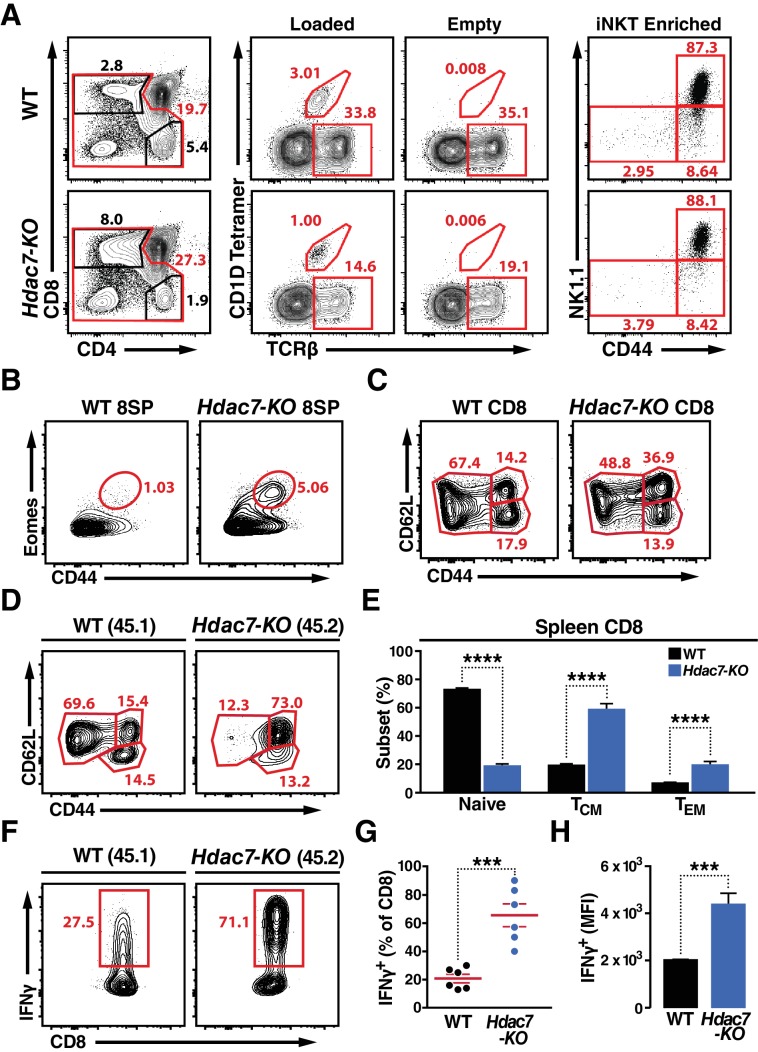
Figure 2. Deletion of HDAC7 in thymocytes Reduces iNKT Numbers and Expands an Innate-Memory CD8 Population.
(A) Representative flow plots showing CD4/CD8 expression (left), loaded and empty CD1D tetramer reactivity (center), and CD44/NK1.1 expression of magnetically enriched iNKT cells (right) from thymus of WT (top) and Hdac7-KO (bottom) thymocytes. (B) Representative flow plots showing an expanded CD44hi Eomes+ innate memory population in mature CD8SP thymocytes from Hdac7-KO mice. Mature CD8 SP thymocytes are identified as TCRβ+CD8+CD4-. (C) Expression of CD44 and CD62L in CD8 T-cells from spleens of WT and Hdac7-KO littermate mice. Data are representative of 3 independent experiments with N = 2–4 mice per group. (D, E) Representative flow plots (D) and total quantification (E) of peripheral naive, central memory (TCM), and effector memory (TEM) CD8 T-cell populations from WT (CD45.1) and Hdac7-KO (CD45.2) derived bone marrow in mixed hematopoietic chimeras. (F, G, H) Representative flow plots (F) and total quantification (G, H) of IFNγ secretion in ex vivo stimulated CD8 T-cells. Splenocytes were harvested from mixed WT (CD45.1)/Hdac7-KO (CD45.2) hematopoietic chimeras, and stimulated ex vivo for 4 hr with PMA/Ionomycin. Percent of cells secreting IFNγ (G) and median fluorescence intensity (MFI) of IFNγ secretion (H) are shown. Bars on graphs indicate mean ±SEM (error bars). Data in (E) are combined from three independent experiments with at least three mice per group; data in (G, H) are combined from three independent experiments with two mice per group. Statistical significance was determined using either unpaired two-tailed T-test (E, H) or two-way ANOVA (G); ***p≤0.001, ****p≤0.0001. A Bonferroni post-test was used for pairwise comparisons in (E).


