. 2018 Apr 17;7:e32109. doi: 10.7554/eLife.32109

Figure 3. HDAC7-ΔP Blocks Innate Effector Development in iNKT Cells and Converts Them to Naive-Like T-cells.

(A, B) Representative flow cytometric plots showing TCRβ vs. PBS-57 tetramer staining (A), and CD44 vs. NK1.1 staining of iNKT cells (B) in thymus (top) and spleen (bottom) of littermate mice with the indicated genotypes. (C, D) Representative staining (C) and total quantification (D) of IFNγ and IL-4 secretion in total splenocytes from littermate mice of the indicated genotypes, stimulated ex vivo for 4 hr with PMA/Ionomycin. (E, F) Representative flow plots (E) showing surface expression of LFA-1 (CD11a/CD18) in splenic iNKT (Tet+/TCRβ+) cells, with quantification for four littermate pairs shown in (F). Bars on graphs indicate mean ±SEM. Data in (D, F) are from three independent experiments. Statistical significance was determined using one-way (E) or two-way (F) ANOVA; *p≤0.05, **p≤0.01, ***p≤0.001, ****p≤0.0001. Tukey (E) or Bonferroni post-tests (F) were used for pairwise comparisons.

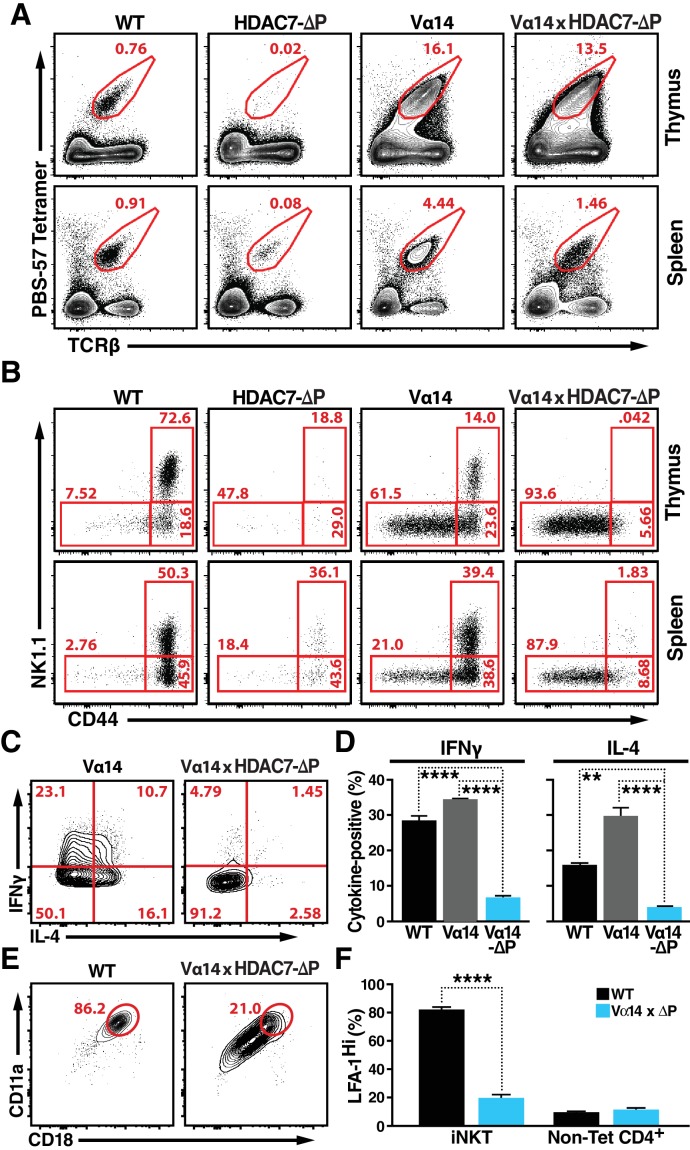
Figure 3—source data 1. Microsoft Excel workbook containing numerical data matrices for all figure panels (on separate sheets) in which individual data points are not represented graphically.
DOI: 10.7554/eLife.32109.014

Figure 3.

Figure 3—figure supplement 1. Supporting Data on iNKT Phenotype of Vα14/Jα18 X HDAC7-ΔP Transgenic Mice.

Figure 3—figure supplement 1.

(A, B) Restoration of iNKT cells (Tet + TCRβ+) in Hdac7-KO mice by expression of the Vα14-Jα18 TCR transgene (A, top row), as well as representative CD44/NK1.1 staging for each genotype (bottom row). Representative plots for the indicated genotypes shown in (A) with total quantification shown in (B) for liver (left), thymus (center), and spleen (right) for at least 3 pairs of littermate mice. (C) Proportion of iNKT cells expressed as percent of total TCRβ+T cells in thymus (left) and spleen (right) from WT, HDAC7-ΔP, Vα14, and Vα14 x HDAC7-ΔP mice. (D) Overlaid histograms of CD24 expression in the CD44-NK1.1- populations from thymocytes of the indicated genotypes, as shown in Figure 3B. (E) Proportion of iNKT cells expressed as percent of total TCRβ+T cells in thymus, spleen and liver from WT and Vα14 x HDAC7-ΔP mice. (F) Fold enrichment of iNKT cells in liver (% total TCRβ+) over spleen (% total TCRβ+) in WT and Vα14 x HDAC7-ΔP mice. Statistical significance was determined using unpaired two-tailed t tests; ***p≤0.001, ****p≤0.0001.