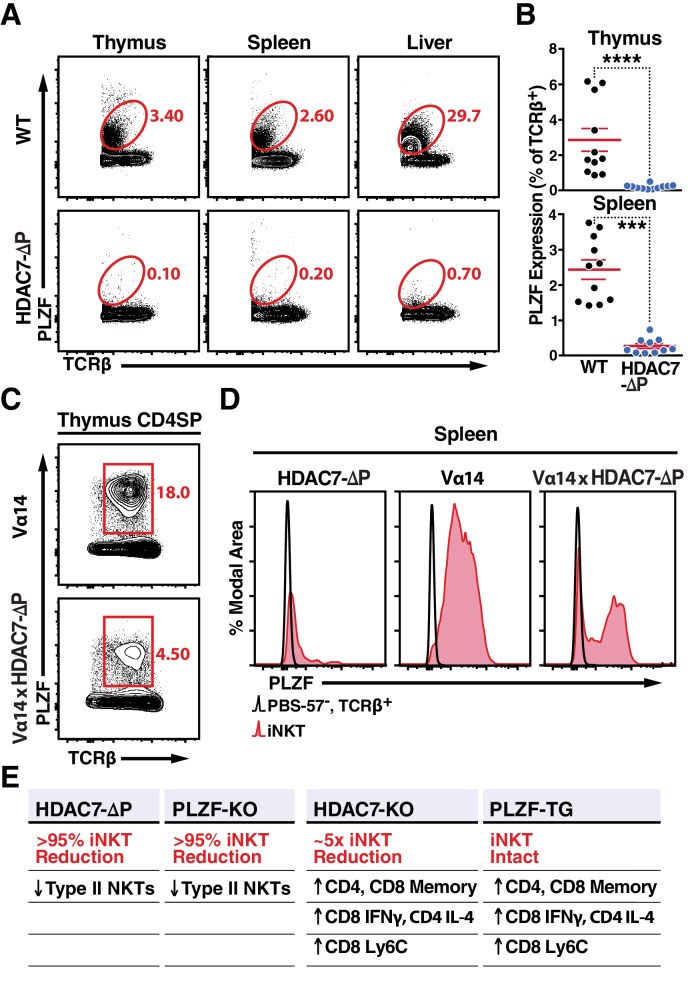
Figure 4. Nuclear HDAC7 Retention Restricts PLZF Expression and Mirrors PLZF-Associated T Cell Phenotypes.
(A, B) Representative flow cytometric plots (A) and total quantification (B) of PLZF expression in TCRβ+ cells from thymus, spleen, and liver. (C) PLZF expression in mature CD4 SP (CD4+ CD8- TCRβ+) thymocytes from Vα14 (top) and Vα14 X HDAC7-ΔP (bottom) transgenic animals. (D) PLZF expression in peripheral iNKT (Tet+ TCRβ+) cells from spleen. Black unfilled histograms correspond to conventional (Tet-TCRβ+) T-cells, red tinted to iNKT (Tet+TCRβ+) cells. (E) Summary table comparing phenotypes in HDAC7-ΔP, PLZF KO, Hdac7-KO and PLZF Tg mice with respect to iNKT and conventional T-cell development. Bars on graphs in (B) indicate mean ±SEM; symbols represent individual mice. Data in (B) are combined from four independent experiments with at least two mice per group; data in (D) are representative of 3 independent experiments with two mice per group; Statistical significance was determined using unpaired two-tailed T-tests (B); ***p≤0.001, ****p≤0.0001 vs. WT.

