. 2018 Apr 17;7:e32109. doi: 10.7554/eLife.32109

Figure 5. HDAC7 Regulates a Cassette of Genes in Glycolipid-Reactive Cells That is Highly Relevant to Innate Effector Function, Inflammation, Autoimmunity, and Autoimmune Liver Disease.

(A) Scatter charts showing gene expression changes in Cd1d/αGalCer-reactive Vα14 Tg (X axis) and Vα14 X HDAC7-ΔP Tg (Y axis) thymocytes (left) or CD4 splenocytes (right) vs naïve CD4SP thymocytes or splenocytes, respectively. The solid gray line indicates the plot diagonal and the dotted gray line indicates the Least Squares best-fit line of the plotted data. Genes displayed were expressed at least 1.75-fold differentially between tetramer-reactive and naïve cells, with p<0.05 (2-tailed Student’s T test) for three biological replicates of each genotype. Colored plot points represent genes whose differential expression vs. naïve was enhanced (red points) or suppressed (green points) at least 1.75-fold by co-expression of HDAC7-ΔP (C, D) Scatter charts showing genes > 1.66 fold differentially expressed due to loss of PLZF function (C, horizontal axis), or due to transgenic expression of PLZF (D, horizontal axis) according to (Mao et al., 2016), plotted against effect of HDAC7-ΔP expression in PBS-57 tetramer-reactive Vα14 X HDAC7-ΔP vs Vα14 Transgenic thymocytes in Thymus (C, vertical axis) or spleen (D, vertical axis). Total number of genes > 1.67 fold differentially expressed along each axis are indicated in gray. Numbers of genes, with P-values (binomial distribution) of the overlap, for genes differentially expressed along both axes in each quadrant (blue symbols), are indicated in blue.

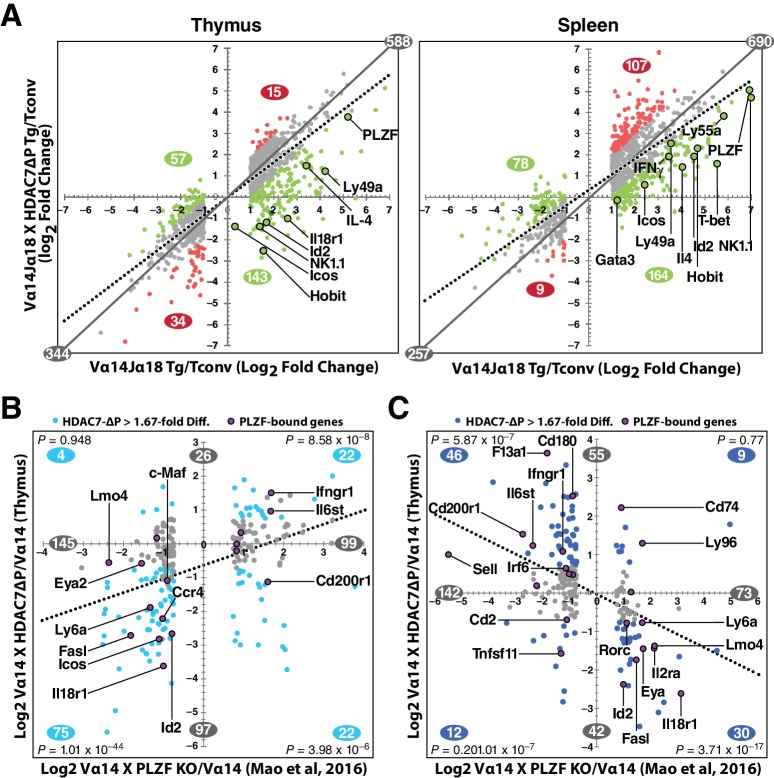
Figure 5.

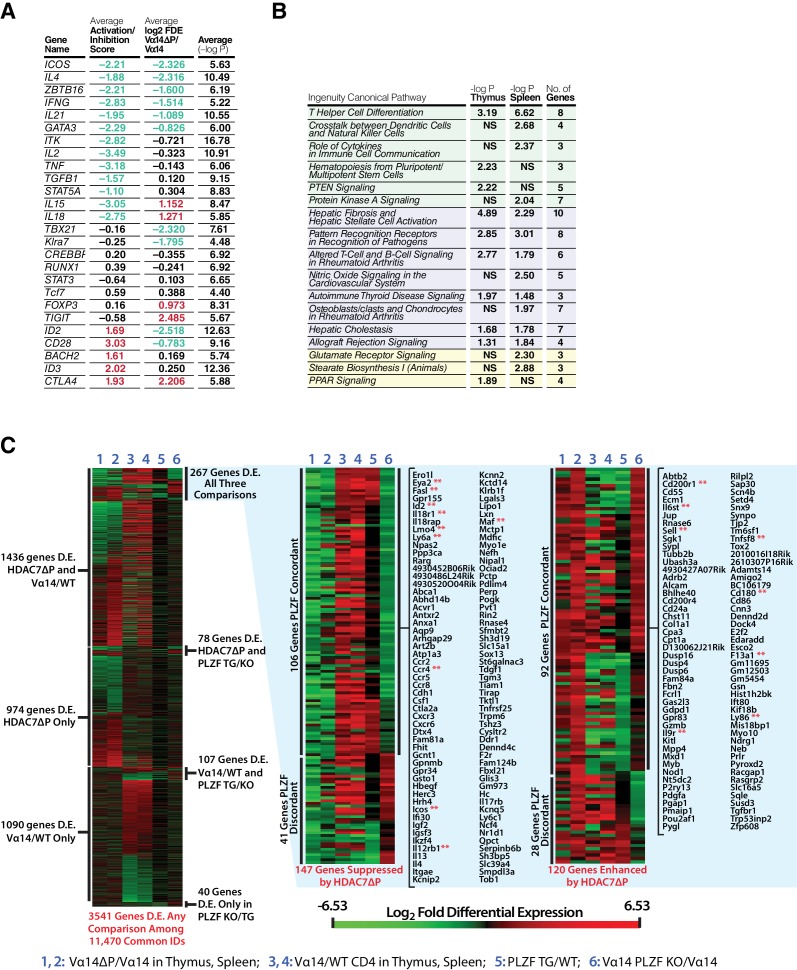
Figure 5—figure supplement 1. HDAC7 Regulates a Cassette of Genes in Glycolipid-Reactive Cells That is Highly Relevant to Innate Effector Function, Inflammation, Autoimmunity, and Autoimmune Liver Disease.

Figure 5—figure supplement 1.

Related to Figure 5. (A) Table showing top putative upstream regulators (Column 1) of the genes from Figure 5A that were suppressed by HDAC7-ΔP, based on analysis with Ingenuity Pathway Analysis (IPA). Values shown in Columns 2–3 are averages of data from thymocytes and splenocytes. Column 2: average activation/inhibition z-score of putative upstream regulators. Column 3: Average log2 fold differential expression (log2 FDE) of indicated genes in Vα14 X HDAC7-ΔP vs. Vα14 iNKT cells. Column 4: Average (-log10P value) of upstream regulator for thymus and spleen. (B) Table of IPA overrepresented canonical signaling pathways in the set of genes analyzed in (A). Green-shaded pathways are involved in innate effector differentiation or function, purple-shaded pathways in inflammation and autoimmunity. (C) Seriated heat maps showing log2 FDE (red is upregulated, green downregulated) for our RNA-seq data and published data on PLZF in iNKT cell development (Mao et al., 2016). Columns 1–4 show our comparisons and columns 5–6 theirs, as indicated at the bottom of the figure. Heatmap at left shows 3541 genes that are differentially expressed in any comparison among the 11,470 genes sharing common IDs between all datasets. Heatmaps at center and right show data for 267 genes differentially expressed due to HDAC7-ΔP expression (columns 1–2), between Tconv and iNKT cells (columns 3–4), and due to gain/loss of PLZF function (columns 5–6). Among these genes, changes during iNKT development that are suppressed by HDAC7-ΔP are shown at center, and those enhanced by HDAC7-ΔP at right.