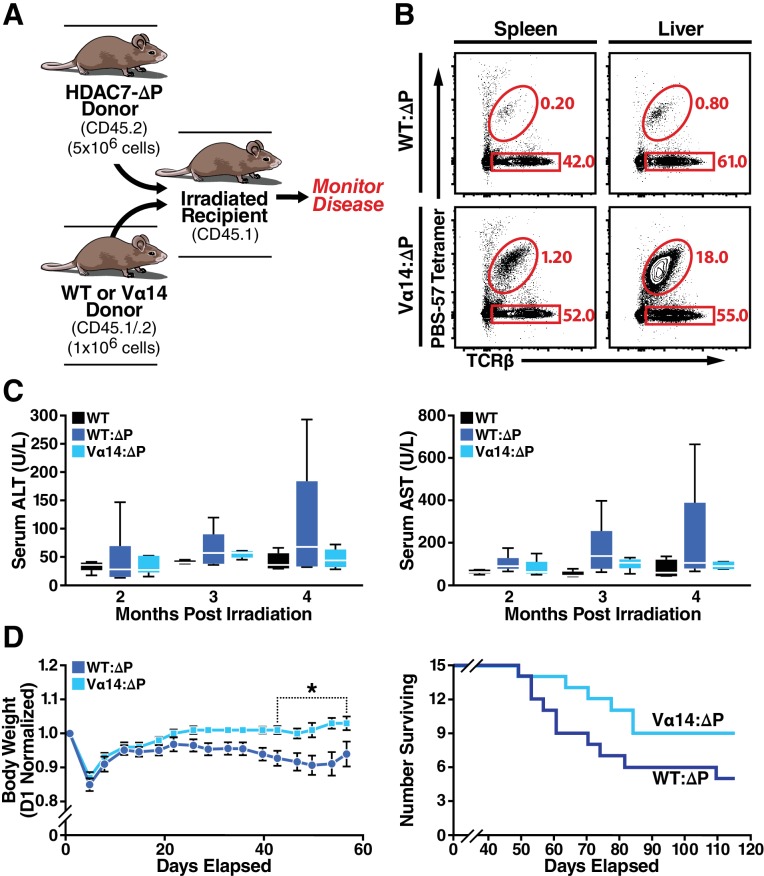
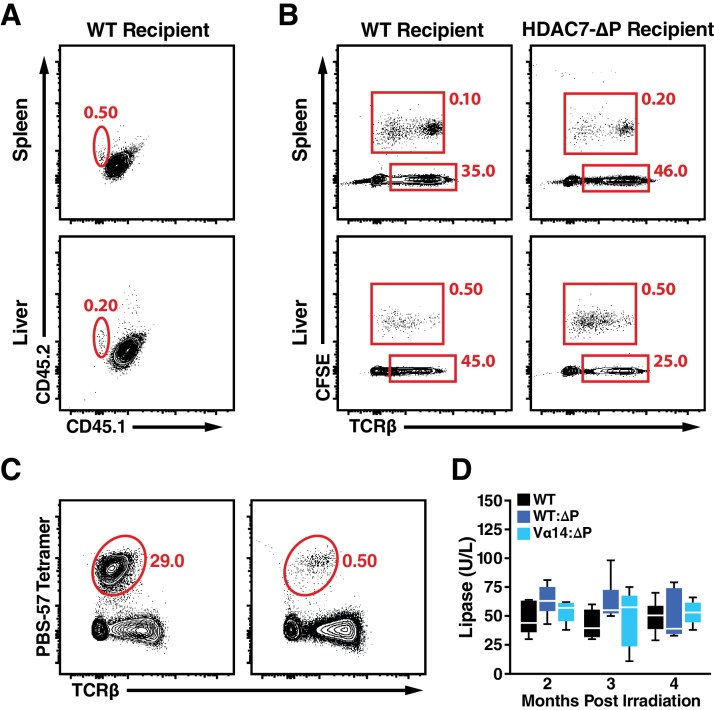
Figure 8. Loss of iNKT Cells in HDAC7ΔP Mice Contributes to Tissue-Specific Autoimmunity.
(A) Schematic of mixed BM chimeras used to monitor HDAC7-ΔP-mediated autoimmunity time course and severity. Lethally irradiated CD45.1 BoyJ recipients were reconstituted (6 × 10⁶ cells) with a 1:5 mixture of either WT (CD45.1): HDAC7-ΔP (CD45.2) or Vα14 (CD45.1): HDAC7ΔP (CD45.2) bone marrow cells. (B) Vα14 bone marrow (bottom) robustly restores peripheral iNKT cells (Tet+ TCRβ+ in liver and spleen in mixed BM chimeras, while WT bone marrow does not. Plots are representative of two sets of independently made chimeras. (C) Plasma concentration of liver (ALT, AST) markers of tissue damage over time measured in WT mice compared to Vα14: HDAC7-ΔP and WT: HDAC7-ΔP BM chimeras. (D) Body weight (left) and survival (right) of mixed BM chimeras over time post-irradiation. Weights in (D) were normalized to starting weight on Day one post-irradiation and measured twice a week thereafter. Survival (D, right) was assessed by monitoring for spontaneous death twice a week or by euthanasia after reaching a clinical endpoint of at least 20% body weight loss compared to peak weight post-irradiation. Using Kaplan-Meier analysis, p=0.0616 by Gehan-Breslow-Wilcoxon tests. Bars on graphs indicate mean ±SEM (error bars); whiskers on box-and-whiskers plots represent min to max. Data in (C) were collected from N = 6 mice per group; data in (D) and (E) were combined from three independent experiments with N = 16 mice total per group. Statistical significance in (D) was determined using two-way ANOVA; *p≤0.05. Bonferroni post-tests were used for pairwise comparisons.


