Figure 4.
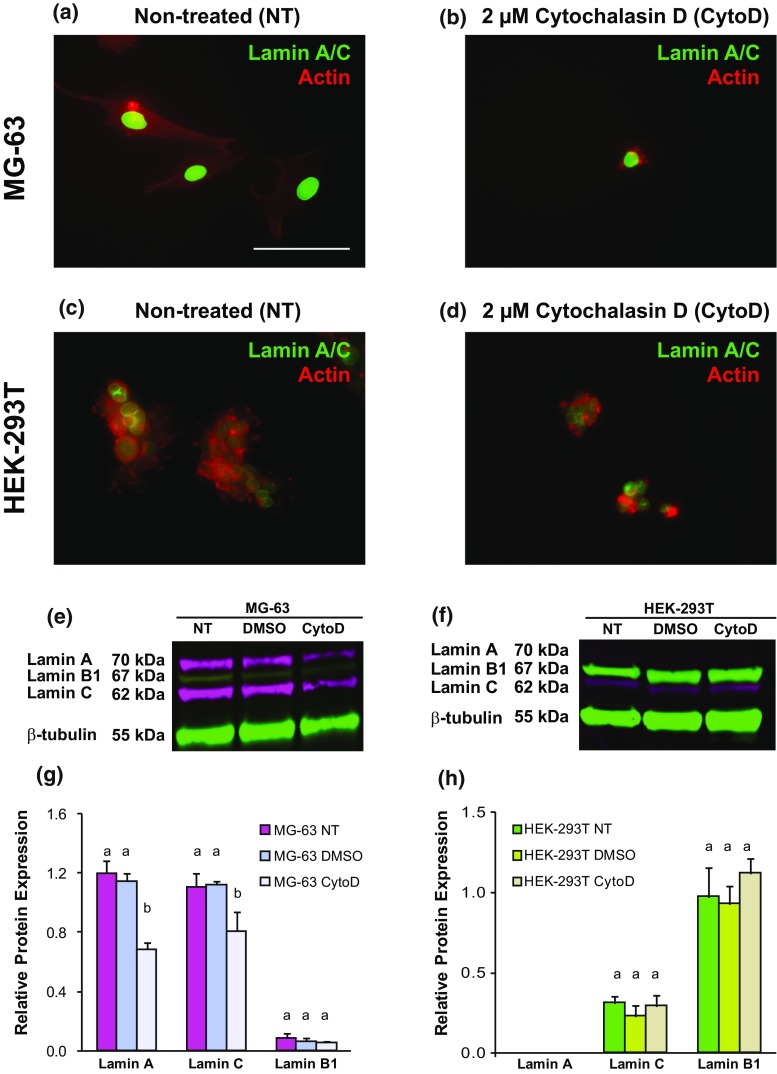
Robust lamin A/C protein expression in stiff MG-63 cells is dependent on actin cytoskeletal organization, whereas weak expression in soft HEK-293T cells is not. (a) Non-treated and (b) CytoD-treated MG-63 cells exhibited a qualitative decrease in lamin A/C levels and dramatic changes in actin organization. (c) Non-treated and (d) CytoD-treated HEK-293T cells both exhibited similar lamin A/C levels, regardless of cytoskeletal disruption, that were much lower than MG-63 cells. (e) Lamin protein expression from MG-63 cells exposed to no treatment (NT), 0.05% DMSO for 1 h (DMSO), or 0.05% DMSO and 2 µM CytoD for 1 h (CytoD). (f) Representative relative lamin protein expression quantification for NT-, DMSO- and CytoD-treated MG-63 cells. (h) Lamin protein expression from HEK-293T cells exposed to the same conditions as described in (e). (h) Representative relative lamin protein expression quantification for NT-, DMSO- and CytoD-treated HEK-293T cells. Lamin A (70 kDa) and C (62 kDa) bands are shown in magenta fluorescence while lamin B1 (67 kDa) and β-tubulin (55 kDa) bands are shown in green fluorescence. Relative protein expression was determined by normalizing all protein expression to β-tubulin (loading control). Statistical significance (p < 0.05) was determined using one-way ANOVA with Tukey post hoc tests. Groups with different letters exhibited statistically significant differences.

