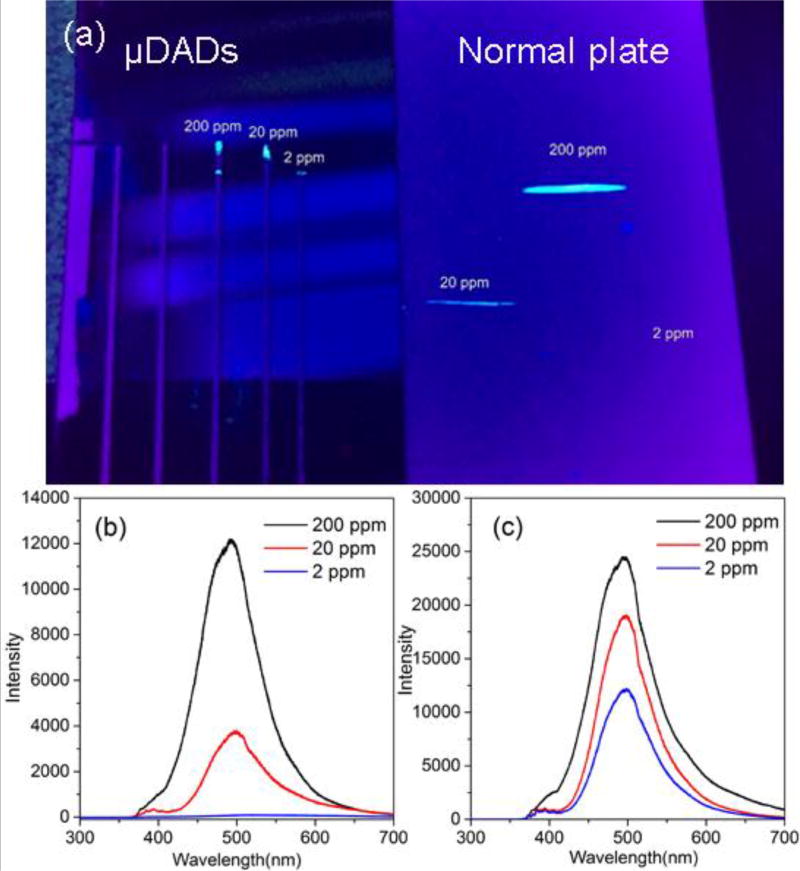
Figure 3.
(a) Photographic images of different concentrations of pyrene separated by μDADs and normal diatomite plates. The spots after separation are visualized by UV light; fluorescence spectra of different concentrations of pyrene separated by normal diatomite chromatography plates (b) and μDADs (c).

