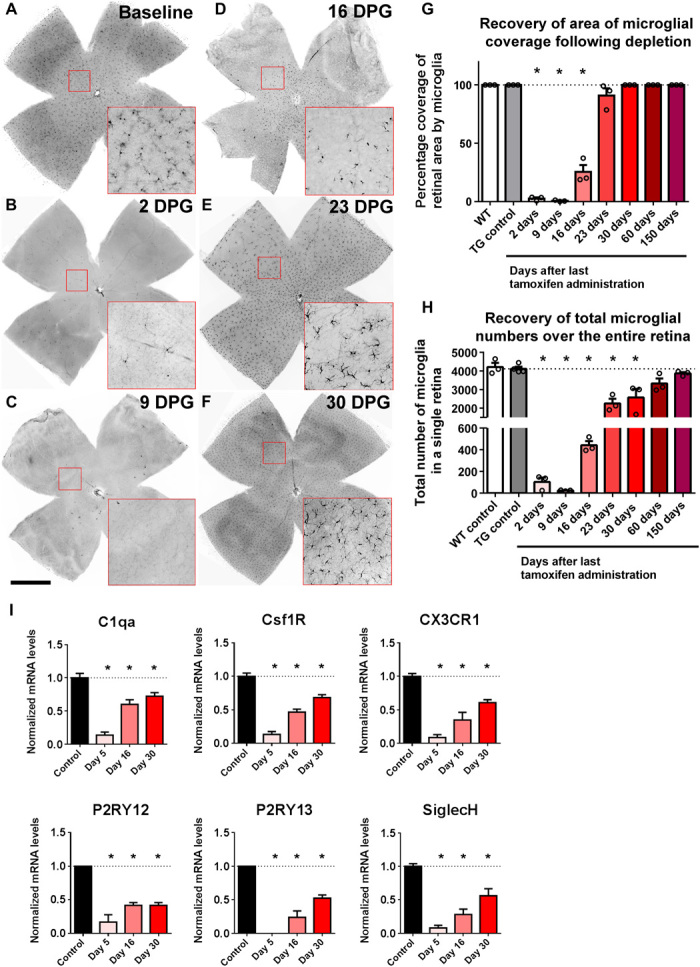
Fig. 1. Microglial repopulation of the adult mouse retina following genetic depletion occurs in a progressive center-to-peripheral direction originating from the optic nerve head.

(A to F) The overall distribution of Iba1-immunopositive cells was analyzed in flat-mounted retinal preparations; insets (red boxes) show repopulating cells at high magnification. (A) Young adult (2 months old) CX3CR1CreER-DTA transgenic mice demonstrated a wild-type–like distribution of microglia in the retina under baseline conditions. (B and C) Following the administration of oral tamoxifen (500 mg/kg per dose, two doses administered 1 day apart) to deplete the retina of microglia, few microglia remained at 2 to 9 days DPG. (D to F) Progressive repopulation of the retina occurred thereafter in a central-to-peripheral direction extending to all topographical areas of the retina. Scale bar, 1 mm. (G) The percentage of the total retinal area occupied by Iba1+ cells was measured at different times following tamoxifen-induced depletion. Repopulating cells extended to all retinal areas by 30 DPG. (H) The total number of Iba1+ cells in the retina following depletion recovered progressively to reach the number present before depletion. (I) mRNA expression levels of microglia-enriched genes in the retina, assessed using next-generation sequencing, demonstrated marked decreases at 5 DPG, followed by progressive recovery at 16 and 30 DPG. mRNA levels of each species were normalized to the mean level of expression in the controls. [Graphical data in (G), (H), and (I) are presented as means ± SEM; one-way analysis of variance (ANOVA) and Sidak’s multiple comparison test, n = 3 animals of mixed sex at each time point, except n = 4 in the transgenic (TG) control group. Asterisks (*) indicate comparisons with control for which P < 0.05.]
