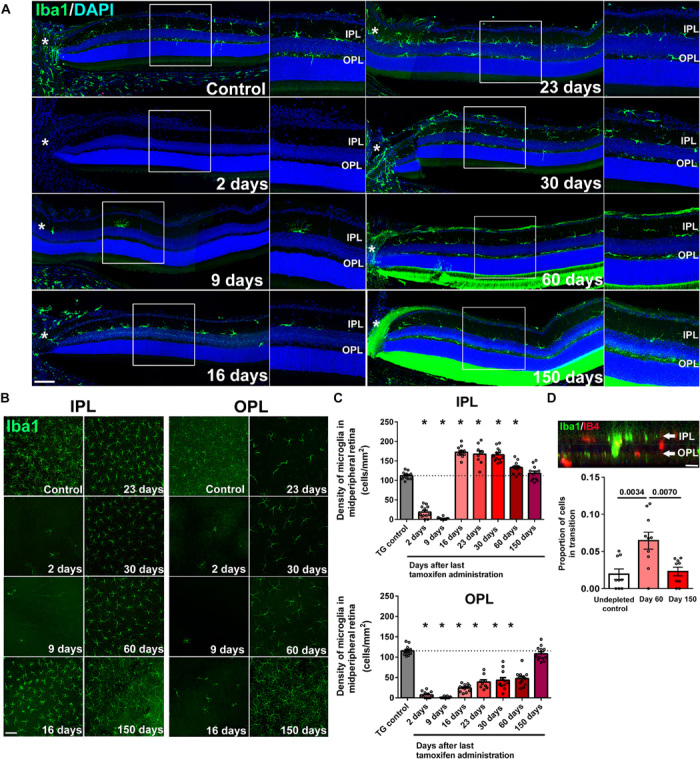
Fig. 2. Microglial repopulation in the retina involves microglial migratory transit in an inner-to-outer direction to reestablish local laminar densities in each plexiform layer.

(A) The spatial pattern of microglia recolonization in separate retinal lamina following depletion was analyzed in retinal sections; asterisks (*) indicate the optic nerve head, and insets show high-magnification views of the IPL and OPL. Near-complete absence of retinal microglia in all retinal layers was observed at 2 DPG, with few Iba1+ cells found only in the IPL near the optic nerve head. At 16 DPG, significant numbers of Iba1+ cells were present in the IPL but were largely absent in the OPL. Recolonization of the OPL progressed at later time points from central to peripheral retinal areas. Scale bar, 50 μm. DAPI, 4′,6-diamidino-2-phenylindole. (B) Repopulation dynamics of Iba1-labeled microglia in the IPL and OPL were analyzed additionally in retinal flat-mounts using confocal microscopy at midpoint between the optic nerve head and the retinal periphery. Scale bar, 100 μm. (C) Quantitative analysis of microglial density demonstrated a rapid repopulation of the IPL at 16 DPG (top) that exceeded the numbers of endogenous microglia present at baseline (TG control). At subsequent time points, microglial density in the IPL slowly declined to baseline levels by 150 DPG. Microglial repopulation of the OPL (bottom) demonstrated a slow progressive recovery, reaching baseline levels by 150 DPG. (D) The proportion of interplexiform Iba1+ cells (with somata located between IPL and OPL lamina), expressed as a fraction of all microglial cells in the imaging field, was assessed at (i) baseline (before depletion), (ii) midway through the repopulation process (60 DPG), and (iii) upon the reattainment of baseline distribution (150 DPG). Scale bar, 10 μm. The proportion of interplexiform Iba1+ cells was significantly greater at 60 DPG than at other time points, indicating an inner-to-outer migration of microglia during repopulation. Graphical data in (C) and (D) are presented as means ± SEM (n = 12 imaging retinal fields from three animals of mixed sex at each time point; P values were derived from one-way ANOVA and Sidak’s multiple comparison test).
