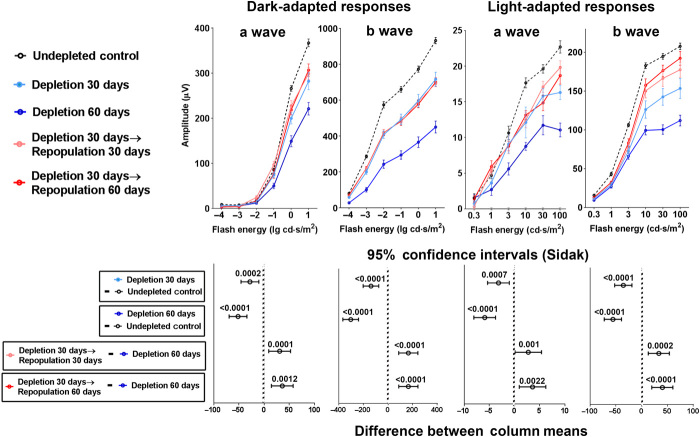
Fig. 5. Microglial repopulation rescues deterioration of retinal function induced by microglia depletion in the CX3CR1CreER-DTA model.
Twelve-week-old CX3CR1CreER-DTA mice were subjected to sustained microglia depletion for 30 days (light blue line). Following this period, experimental mice were divided into three subgroups: (i) maintained microglial depletion for another 30 days (total of 60 days) (dark blue line), (ii) repopulation for 30 days (pink line), and (iii) repopulation for 60 days (red line). Undepleted CX3CR1CreER-DTA mice served as controls (black dashed line). Sustained microglial depletion resulted in decreases in ERG responses in the a- and b-wave amplitudes that progressed from 30 to 60 days depletion. In the groups undergoing repopulation, these further decrements in ERG responses were halted and were significantly greater than those in animals undergoing 60 days sustained depletion. Upper panels show ERG amplitudes in all subgroups with data points and error bars indicating mean responses ± SEM. Lower panels show statistical comparisons between subgroups with data points and error bars indicating mean differences and ±95% confidence intervals [error bars not crossing x = 0 indicate significant (P < 0.05) comparisons]. Two-way ANOVA with Sidak’s multiple comparison test was used to calculate P values; n = 24 eyes in 12 animals in the control subgroup, and n = 8 eyes in 4 animals for all other subgroups.

