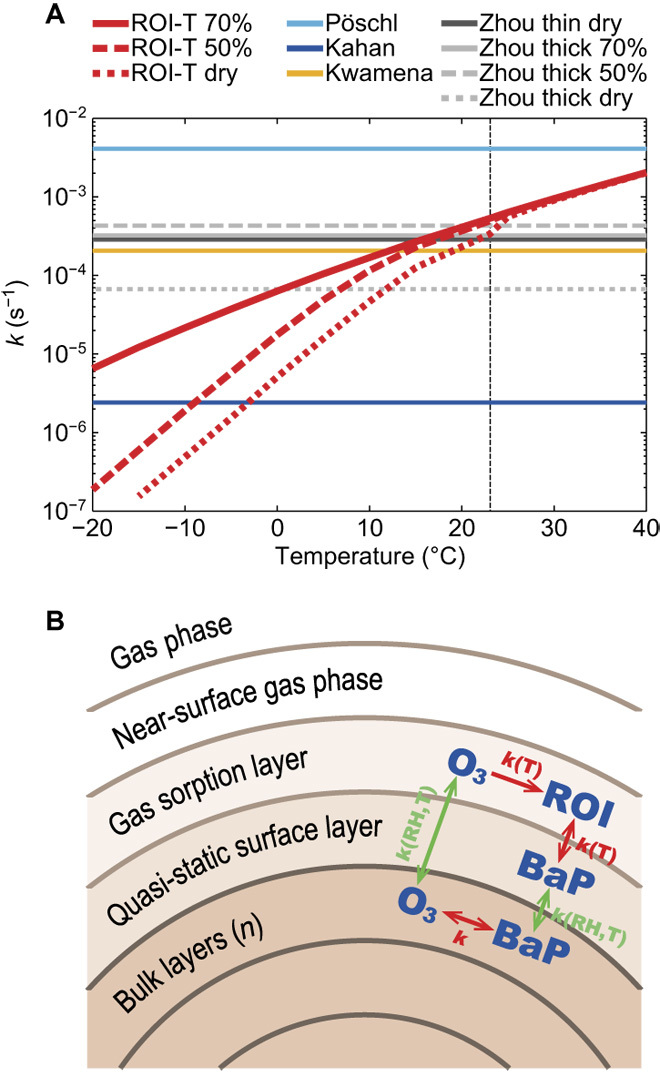
Fig. 1. Kinetic scheme ROI-T.

(A) First-order multiphase degradation rate coefficient k (s−1) for laboratory schemes of Pöschl et al. (4), Kahan et al. (22), Kwamena et al. (5), and Zhou et al. (11) (table S1) and the kinetic scheme ROI-T at 50 ppb O3. Vertical dashed line denotes 23°C. (B) Model framework of the multilayer kinetic scheme ROI-T. Red arrows show the reactions: O3 is decomposed and forms ROI in the gas sorption layer, BaP reacts with ROI between gas sorption and surface layer, and BaP reacts with O3 in the bulk. Green arrows show the RH/T-dependent mass transport: O3 from gas sorption to bulk layer, BaP from bulk to surface layer.
